


Broad Jump Benchmarks by Sport, Gender, and Level
This post covers standing broad jump benchmarks across nine sports for both genders, at competition levels from middle school through professional. A coach running group power testing with a broad jump mat can use the tables below to interpret a single test result against athlete norms for the athlete's sport, gender, and level.
A note on the numbers. The benchmarks in this post are drawn from peer-reviewed literature, published combine data, and established normative datasets. Where direct data exists for the sport, we used it. Where data is limited, particularly at the middle school level, for women's sports, and for sports without standardized combine testing, figures are extrapolated from peer-reviewed youth percentile data, position-equivalent sports with similar power demands, and age-adjusted development curves. All numbers should be treated as reference ranges, not absolute targets, and interpreted alongside the athlete's sport, position, training age, and testing protocol.
Where the Average Athlete Actually Stands
The tables below cover the full range from average to elite, for both males and females, from middle school through professional. Start here before going sport-specific.
Males
| Stage | Average | Good | Advanced | Elite |
|---|---|---|---|---|
| Middle School (12-14) | 5'8" to 6'6" | 6'7" to 7'3" | 7'4" to 7'11" | 8'0"+ |
| High School (14-18) | 6'10" to 7'8" | 7'9" to 8'5" | 8'6" to 9'1" | 9'2"+ |
| College (18-22) | 8'0" to 8'10" | 8'11" to 9'6" | 9'7" to 10'2" | 10'3"+ |
| Professional (22-32) | 8'6" to 9'4" | 9'5" to 10'0" | 10'1" to 10'8" | 10'9"+ |
Females
| Stage | Average | Good | Advanced | Elite |
|---|---|---|---|---|
| Middle School (12-14) | 4'4" to 5'0" | 5'1" to 5'8" | 5'9" to 6'2" | 6'3"+ |
| High School (14-18) | 5'2" to 5'10" | 5'11" to 6'6" | 6'7" to 7'1" | 7'2"+ |
| College (18-22) | 6'0" to 6'8" | 6'9" to 7'4" | 7'5" to 8'0" | 8'1"+ |
| Professional (22-32) | 6'4" to 7'0" | 7'1" to 7'8" | 7'9" to 8'3" | 8'4"+ |
A trained athlete in any organized strength and conditioning program for more than a year should sit at "good" or above for their age and gender. The female plateau between ages 13 and 14 is documented in Tomkinson 2018 and Catley & Tomkinson 2013: girls' broad jump distance plateaus around adolescence while boys continue to gain steadily through age 18. The growing gap reaches roughly 33 percent by 18.
Sport-by-Sport Broad Jump Benchmarks
The tables below assume a standard standing broad jump protocol: two-foot take-off, arm swing allowed, measurement taken from the take-off line to the back of the heel on landing, best of three trials with a stuck landing. Different testing protocols produce different numbers. Cross-program comparisons require matching protocols on both sides.
Football
The NFL Combine is the largest published broad jump dataset in any sport. Across roughly 4,600 athletes tested between 1999 and 2014, broad jump averages by position cluster around 9'5" to 9'10" (113 to 118 in) at the league level, with a wide spread by position. The combine record is Byron Jones at 12'3", set in 2015.
| Level | Average | Good | Advanced | Elite |
|---|---|---|---|---|
| Middle School | 5'8" to 6'6" | 6'7" to 7'4" | 7'5" to 8'2" | 8'3"+ |
| High School | 7'2" to 8'2" | 8'3" to 9'1" | 9'2" to 9'10" | 9'11"+ |
| College | 8'6" to 9'4" | 9'5" to 10'1" | 10'2" to 10'10" | 10'11"+ |
| NFL | 9'6" to 10'2" | 10'3" to 10'10" | 10'11" to 11'5" | 11'6"+ |
Position spread is wider in football than in any other sport on this list. At the combine the gap runs from cornerbacks and wide receivers averaging around 10'6" to 10'8" down to offensive and defensive linemen near 8'8", close to a two-foot difference inside the same league. Skill positions are built for acceleration and horizontal power, which is what the broad jump measures. A position-by-position table is the right follow-up for football specifically.
Basketball
Basketball does not test broad jump as systematically as football. The NBA Combine focuses on vertical jump as the primary lower-body power test.
Men's Basketball
| Level | Average | Good | Advanced | Elite |
|---|---|---|---|---|
| Middle School | 5'8" to 6'5" | 6'6" to 7'3" | 7'4" to 8'0" | 8'1"+ |
| High School | 7'0" to 8'0" | 8'1" to 8'10" | 8'11" to 9'7" | 9'8"+ |
| College | 8'4" to 9'2" | 9'3" to 9'10" | 9'11" to 10'5" | 10'6"+ |
| Professional | 9'0" to 9'8" | 9'9" to 10'4" | 10'5" to 11'0" | 11'1"+ |
Women's Basketball
| Level | Average | Good | Advanced | Elite |
|---|---|---|---|---|
| Middle School | 4'6" to 5'2" | 5'3" to 5'10" | 5'11" to 6'4" | 6'5"+ |
| High School | 5'4" to 6'1" | 6'2" to 6'9" | 6'10" to 7'4" | 7'5"+ |
| College | 6'4" to 7'0" | 7'1" to 7'8" | 7'9" to 8'2" | 8'3"+ |
| Professional | 6'10" to 7'6" | 7'7" to 8'2" | 8'3" to 8'10" | 8'11"+ |
Guards typically test 6 to 10 inches farther than centers and post players at the same level. Guards are lighter and selected for first-step acceleration, which is horizontal power the broad jump captures directly. Centers carry more mass and are valued for standing reach and vertical contests at the rim, qualities a horizontal jump does not reward. The gap tends to widen as the level rises and roster roles specialize.
Volleyball
Volleyball does not use broad jump as a primary test, but jump-trained athletes generally produce comparable horizontal results to basketball athletes at the same level.
Men's Volleyball
| Level | Average | Good | Advanced | Elite |
|---|---|---|---|---|
| Middle School | 5'6" to 6'3" | 6'4" to 7'1" | 7'2" to 7'10" | 7'11"+ |
| High School | 6'10" to 7'10" | 7'11" to 8'8" | 8'9" to 9'4" | 9'5"+ |
| College | 8'0" to 8'10" | 8'11" to 9'6" | 9'7" to 10'2" | 10'3"+ |
| Professional / Club | 8'8" to 9'4" | 9'5" to 10'0" | 10'1" to 10'8" | 10'9"+ |
Women's Volleyball
| Level | Average | Good | Advanced | Elite |
|---|---|---|---|---|
| Middle School | 4'4" to 5'0" | 5'1" to 5'8" | 5'9" to 6'2" | 6'3"+ |
| High School | 5'4" to 6'1" | 6'2" to 6'9" | 6'10" to 7'4" | 7'5"+ |
| College | 6'2" to 6'10" | 6'11" to 7'6" | 7'7" to 8'1" | 8'2"+ |
| Professional / Club | 6'8" to 7'4" | 7'5" to 8'0" | 8'1" to 8'8" | 8'9"+ |
Outside hitters and middle blockers typically test toward the upper end at any given level, since both train an explosive approach jump that shares the hip and ankle drive of a broad jump. Liberos test lower but produce high reactive output on short ground contacts, a quality the broad jump does not capture, so reading a libero's number without that context undersells them.
Soccer
D1 collegiate soccer broad jump data correlates strongly with 0-5m and 0-10m acceleration tests, which is why a number of programs use it as a horizontal-power proxy in season. Professional men's broad jump averages cluster in the 7'10" to 8'10" (2.4 to 2.7 m) range across European and South American studies. The same physical quality drives 10-yard dash performance, which is why broad-jump-strong soccer players also tend to post fast 0-10m splits.
Men's Soccer
| Level | Average | Good | Advanced | Elite |
|---|---|---|---|---|
| Middle School | 5'4" to 6'1" | 6'2" to 6'10" | 6'11" to 7'6" | 7'7"+ |
| High School / Club | 6'10" to 7'8" | 7'9" to 8'6" | 8'7" to 9'2" | 9'3"+ |
| College / Professional | 7'10" to 8'8" | 8'9" to 9'5" | 9'6" to 10'1" | 10'2"+ |
Women's Soccer
| Level | Average | Good | Advanced | Elite |
|---|---|---|---|---|
| Middle School | 4'4" to 5'0" | 5'1" to 5'8" | 5'9" to 6'2" | 6'3"+ |
| High School / Club | 5'4" to 6'1" | 6'2" to 6'9" | 6'10" to 7'4" | 7'5"+ |
| College / Professional | 6'2" to 6'10" | 6'11" to 7'6" | 7'7" to 8'2" | 8'3"+ |
Forwards and outside backs tend to test highest, because their roles demand repeated maximal accelerations and recovery sprints, the same horizontal power the broad jump reads. Central midfielders and central defenders cluster around the team average, where positioning and endurance matter more than top-end burst. Goalkeepers vary widely depending on their off-field training background, since the position itself does not build horizontal jump.
Baseball and Softball
MLB Prospect Development Pipeline combine data gives the cleanest baseball broad jump dataset. The 2023 MLB Combine reported a mean broad jump of 8'11" (107.1 in) across attendees, with top performers in 2024 reaching 10'0" to 10'3" (119.75 to 123 in).
Baseball
| Level | Average | Good | Advanced | Elite |
|---|---|---|---|---|
| Middle School | 5'6" to 6'3" | 6'4" to 7'1" | 7'2" to 7'10" | 7'11"+ |
| High School | 6'10" to 7'10" | 7'11" to 8'8" | 8'9" to 9'4" | 9'5"+ |
| College | 8'0" to 8'10" | 8'11" to 9'6" | 9'7" to 10'2" | 10'3"+ |
| Professional | 8'8" to 9'4" | 9'5" to 10'0" | 10'1" to 10'8" | 10'9"+ |
Softball
| Level | Average | Good | Advanced | Elite |
|---|---|---|---|---|
| Middle School | 4'2" to 4'10" | 4'11" to 5'6" | 5'7" to 6'0" | 6'1"+ |
| High School | 5'0" to 5'9" | 5'10" to 6'4" | 6'5" to 7'0" | 7'1"+ |
| College | 5'10" to 6'6" | 6'7" to 7'2" | 7'3" to 7'9" | 7'10"+ |
| Professional | 6'4" to 7'0" | 7'1" to 7'8" | 7'9" to 8'3" | 8'4"+ |
Outfielders and middle infielders tend to test highest in baseball, because range and first-step quickness are core to those positions and both track horizontal power. Catchers and corner infielders trend lower, valued for arm strength and bat over lower-body burst, and they cover less ground per play. Pitchers vary widely based on their training background. Softball follows the same pattern: middle infielders and outfielders at the top, catchers and corner infielders below team average.
Track and Field
The standing broad jump correlates with sprint performance through horizontal power production, particularly at the 0 to 10 meter acceleration window. Elite sprinters produce standing broad jumps around 10 feet, and the best jumpers push past 11. The data below reflects sprinters and jumpers specifically. Distance runners typically test below these ranges because horizontal power is not their training priority.
Men's Track and Field
| Level | Average | Good | Advanced | Elite |
|---|---|---|---|---|
| Middle School | 5'10" to 6'8" | 6'9" to 7'5" | 7'6" to 8'2" | 8'3"+ |
| High School | 7'2" to 8'2" | 8'3" to 9'0" | 9'1" to 9'9" | 9'10"+ |
| College | 8'6" to 9'4" | 9'5" to 10'1" | 10'2" to 10'8" | 10'9"+ |
| Elite / Olympic | 9'4" to 10'2" | 10'3" to 10'10" | 10'11" to 11'5" | 11'6"+ |
Women's Track and Field
| Level | Average | Good | Advanced | Elite |
|---|---|---|---|---|
| Middle School | 4'6" to 5'2" | 5'3" to 5'10" | 5'11" to 6'4" | 6'5"+ |
| High School | 5'6" to 6'3" | 6'4" to 7'0" | 7'1" to 7'8" | 7'9"+ |
| College | 6'6" to 7'2" | 7'3" to 7'10" | 7'11" to 8'5" | 8'6"+ |
| Elite / Olympic | 7'8" to 8'4" | 8'5" to 9'0" | 9'1" to 9'6" | 9'7"+ |
High jumpers and long jumpers populate the top of these ranges. The horizontal force-velocity profile that drives 10 meter acceleration also drives broad jump distance, which is why sprint coaches use the test as a quick power readout.
Rugby
Professional rugby league data from the Newcastle Knights squad (n=81) reports a mean broad jump of 8'11" (2.73 m) with a range of 7'9" to 10'2" (2.36 to 3.11 m). Professional rugby union research shows backs outperform forwards in horizontal jump output by a wide margin, often 6 to 10 inches at the same level.
Men's Rugby
| Level | Average | Good | Advanced | Elite |
|---|---|---|---|---|
| Middle School | 5'6" to 6'3" | 6'4" to 7'1" | 7'2" to 7'10" | 7'11"+ |
| High School | 7'0" to 8'0" | 8'1" to 8'10" | 8'11" to 9'7" | 9'8"+ |
| College | 8'2" to 9'2" | 9'3" to 9'10" | 9'11" to 10'5" | 10'6"+ |
| Professional | 8'8" to 9'6" | 9'7" to 10'2" | 10'3" to 10'10" | 10'11"+ |
Women's Rugby
| Level | Average | Good | Advanced | Elite |
|---|---|---|---|---|
| Middle School | 4'4" to 5'0" | 5'1" to 5'8" | 5'9" to 6'2" | 6'3"+ |
| High School | 5'4" to 6'1" | 6'2" to 6'9" | 6'10" to 7'4" | 7'5"+ |
| College | 6'2" to 6'10" | 6'11" to 7'6" | 7'7" to 8'2" | 8'3"+ |
| Professional | 6'8" to 7'4" | 7'5" to 8'0" | 8'1" to 8'8" | 8'9"+ |
The wide range within these tables reflects the positional spread between backs and forwards. Outside backs, wingers, and centers test 6 to 10 inches farther than props and hookers at the same level, because backs are selected and trained as sprinters while forwards are built for mass and collision work in the set piece. A team-average broad jump number in rugby obscures this spread, so position-grouped data would be a natural follow-up.
Hockey
The NHL Combine includes a standing long jump in its testing battery. Published individual marks include Brendan Guhle at 10'2" (122 in) in 2015 and Joshua Norris at 9'10" (118 in).
Men's Hockey
| Level | Average | Good | Advanced | Elite |
|---|---|---|---|---|
| Middle School | 5'4" to 6'1" | 6'2" to 6'10" | 6'11" to 7'6" | 7'7"+ |
| High School | 6'10" to 7'8" | 7'9" to 8'6" | 8'7" to 9'2" | 9'3"+ |
| College | 8'0" to 8'10" | 8'11" to 9'4" | 9'5" to 9'10" | 9'11"+ |
| Professional | 8'8" to 9'4" | 9'5" to 9'10" | 9'11" to 10'2" | 10'3"+ |
Women's Hockey
| Level | Average | Good | Advanced | Elite |
|---|---|---|---|---|
| Middle School | 4'4" to 5'0" | 5'1" to 5'8" | 5'9" to 6'2" | 6'3"+ |
| High School | 5'2" to 5'10" | 5'11" to 6'6" | 6'7" to 7'1" | 7'2"+ |
| College | 6'0" to 6'8" | 6'9" to 7'4" | 7'5" to 8'0" | 8'1"+ |
| Professional | 6'6" to 7'2" | 7'3" to 7'10" | 7'11" to 8'6" | 8'7"+ |
Forwards and defensemen test similarly, because both rely on the same skating stride and hip extension the broad jump reflects. Goaltenders vary widely depending on their off-ice training, since the position emphasizes lateral quickness and flexibility over horizontal power. Hockey skating power transfers cleanly to broad jump distance, which is why the NHL Combine includes the test.
Lacrosse
Lacrosse does not aggregate broad jump data the way football and baseball do.
Men's Lacrosse
| Level | Average | Good | Advanced | Elite |
|---|---|---|---|---|
| Middle School | 5'4" to 6'1" | 6'2" to 6'10" | 6'11" to 7'6" | 7'7"+ |
| High School | 6'10" to 7'8" | 7'9" to 8'6" | 8'7" to 9'2" | 9'3"+ |
| College | 8'0" to 8'10" | 8'11" to 9'6" | 9'7" to 10'2" | 10'3"+ |
| Professional | 8'6" to 9'2" | 9'3" to 9'10" | 9'11" to 10'5" | 10'6"+ |
Women's Lacrosse
| Level | Average | Good | Advanced | Elite |
|---|---|---|---|---|
| Middle School | 4'4" to 5'0" | 5'1" to 5'8" | 5'9" to 6'2" | 6'3"+ |
| High School | 5'2" to 5'10" | 5'11" to 6'6" | 6'7" to 7'1" | 7'2"+ |
| College | 6'0" to 6'8" | 6'9" to 7'4" | 7'5" to 8'0" | 8'1"+ |
| Professional | 6'6" to 7'2" | 7'3" to 7'10" | 7'11" to 8'6" | 8'7"+ |
Positional spread in lacrosse is narrower than football or rugby, because most field positions share similar running and dodging demands rather than splitting into sprinters and heavy collision players. Midfielders and attackmen tend to test highest, given the volume of transition sprinting they cover. Goalkeepers vary based on their off-field training. Women's D1 lacrosse research finds minimal position-based variation across field positions.
Understanding Your Numbers
Testing protocol controls more of the number than people realize. Take-off line, landing rules, surface, and footwear all change the recorded distance, though not equally. The biggest differences come from measurement: where the take-off line sits and whether the jump is read to the back of the heel or the nearest point of contact on landing can move the number by several inches. Footwear and surface matter less than people assume, with research finding standing jump distance largely unchanged across shoe types. A tape-measured high school number and a mat-measured college number cannot be compared unless the protocol matches.
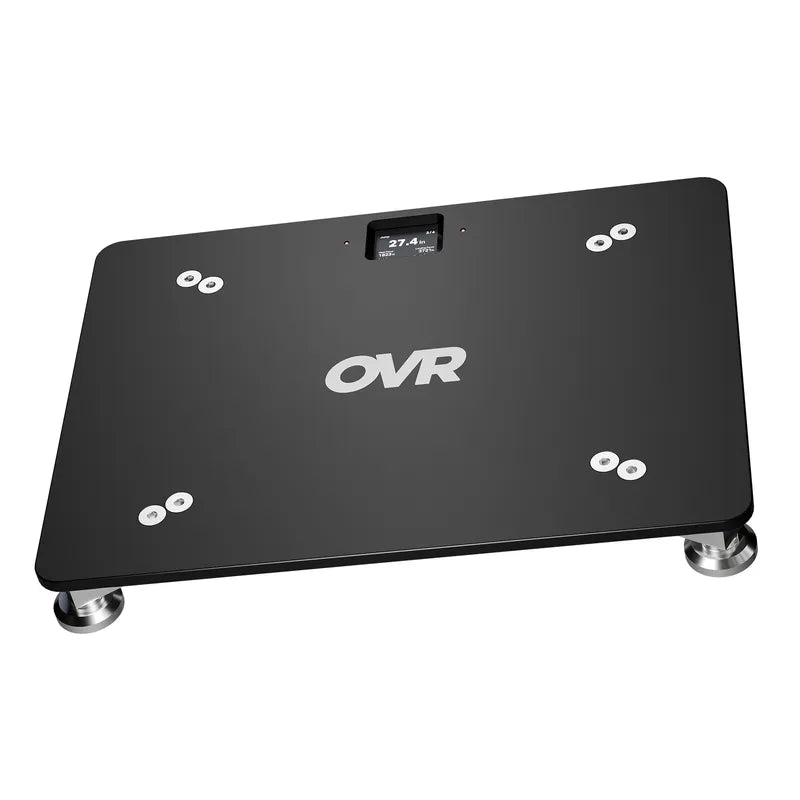
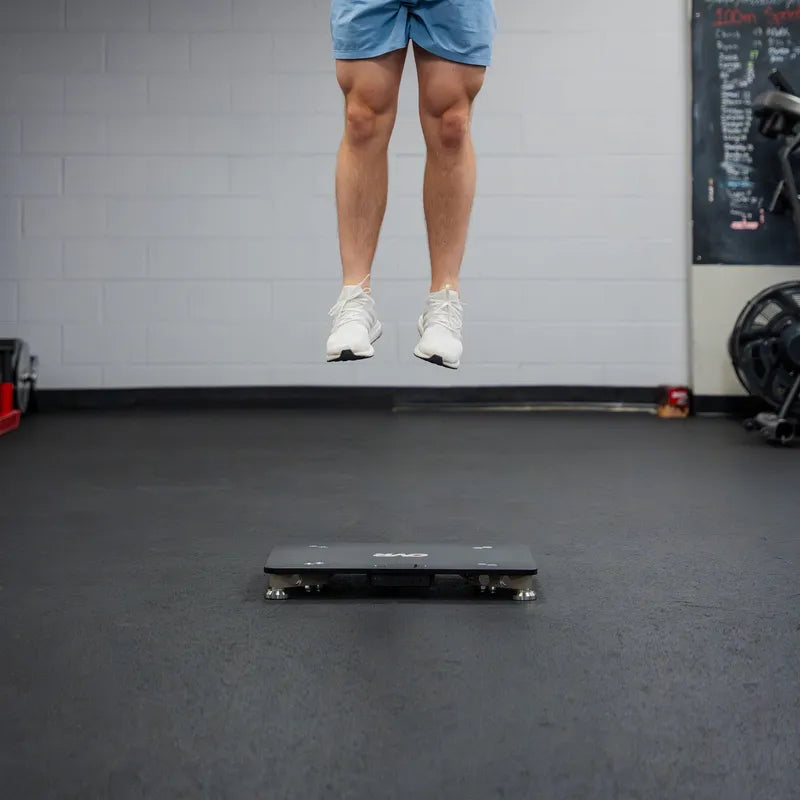
A broad jump mat with preprinted inch markings is the cleanest setup for group testing. Each athlete completes three trials in under two minutes. The number is read off the mat at the back of the heel and recorded immediately. Comparing a test result against the benchmarks above only holds when both sides use the same protocol.
The broad jump and the vertical jump capture related but distinct qualities. Correlation between the two ranges from r=0.37 to r=0.68 across most studies, which means one number partially predicts the other without replacing it. Athletes whose sport demands horizontal acceleration (sprinters, soccer players, defensive backs) often produce a stronger broad jump than vertical jump relative to their bodyweight. Athletes whose sport demands vertical projection (volleyball, basketball, high jumpers) tend toward the opposite. Reading vertical jump versus broad jump for the same athlete reveals whether they project power better vertically or horizontally.
What to Do With a Benchmark
The number is a starting point, not an endpoint. A broad jump test result interpreted against the table above identifies where an athlete sits on a single day. What matters more is the trend across multiple tests inside a training block. The same athlete tested every 6 to 8 weeks reveals whether the program is producing the adaptation it targets. A single test against a benchmark answers "where am I." A trend across four tests answers "is the work working."
Position context matters as much as sport context for some sports. A 9'0" broad jump for a high school football wide receiver sits at the upper end of "good" for the position. The same number for an offensive lineman sits well into "elite." Aggregating both into a single team average obscures real differences. Coaches running multiple position groups through the same testing battery should split the data by position before drawing conclusions.
Broad jump fits best when it is read alongside vertical jump, sprint times, and strength numbers rather than in isolation. An athletic profile across multiple tests separates the same broad jump number into a strength-limited athlete and a power-limited athlete with different training prescriptions. Protocol consistency is the difference between data that compounds and data that doesn't. Lock in the surface, the footwear, the take-off line, the arm swing rule, and the landing rule from the first test. Apply the same rules at every subsequent test. The benchmark in this post assumes that consistency. Without it, the numbers cannot be compared to anything, including themselves.
Sources
- Tomkinson, G. R., Lang, J. J., Blanchard, J., Léger, L. A., & Tremblay, M. S. (2023). European fitness landscape for children and adolescents: updated reference values from the FitBack network (~8 million test results, 34 countries). British Journal of Sports Medicine.
- Petrigna, L., Karsten, B., Marcolin, G., Paoli, A., D'Antona, G., Palma, A., & Bianco, A. (2020). Percentile values of the standing broad jump in children and adolescents aged 6-18 years old. Sport Sciences for Health.
- Castro-Piñero, J., Padilla-Moledo, C., et al. (2024). Criterion-related validity and reliability of the standing long jump test in adults: the Adult-Fit project. European Journal of Sport Science.
- Castro-Piñero, J., Artero, E. G., España-Romero, V., et al. (2010). Criterion-related validity of field-based fitness tests in youth: a systematic review. British Journal of Sports Medicine, 44, 934-943.
- Kuzmits, F. E., & Adams, A. J. (2008). The NFL Combine: does it predict performance in the NFL? Journal of Strength and Conditioning Research, 22(6), 1721-1727.
- Robbins, D. W. (2010). Positional physical characteristics of players drafted into the NFL. Journal of Strength and Conditioning Research, 24(11), 2924-2930.
- NFL Scouting Combine 1999-2014 normative reference values (n=4,603). Journal of Strength and Conditioning Research.
- MLB Prospect Development Pipeline. (2024). Broad jump statistics and data.
- LPS Athletic. (2024). NFL Combine records: athlete benchmark testing standards.
- LPS Athletic. (2024). NHL Combine scout results: top performers and physical attributes.
- Sams, M. L., Sato, K., DeWeese, B. H., Sayers, A. L., & Stone, M. H. (2018). Relationships and predictive capabilities of jump assessments to soccer-specific field test performance in Division I collegiate players. Journal of Strength and Conditioning Research, 32(8), 2310-2317.
- Haugen, T. A., Tønnessen, E., & Seiler, S. (2014). Speed and countermovement-jump characteristics of elite female soccer players, 1995-2010. International Journal of Sports Physiology and Performance, 9(2), 250-256.
- Loturco, I., Pereira, L. A., et al. (2020). Curve sprint in elite female soccer players: relationship with linear sprint and jump performance. International Journal of Environmental Research and Public Health, 17(21), 7910.
- Argus, C. K., Gill, N. D., & Keogh, J. W. L. (2012). Characterization of the differences in strength and power between different levels of competition in rugby union players. Journal of Strength and Conditioning Research, 26(10), 2698-2704.
- Smart, D. J., Hopkins, W. G., Quarrie, K. L., & Gill, N. D. (2014). The relationship between physical fitness and game behaviours in rugby union players. European Journal of Sport Science, 14(sup1), S8-S17.
- Smart, D., et al. (2020). Physical and fitness characteristics of elite professional rugby union players. Sports, 8(6), 85.
- Queensland Rugby League. (2022). Physical performance framework: standing broad jump test protocol.
- Maulder, P., & Cronin, J. (2005). Horizontal and vertical jump assessment: reliability, symmetry, discriminative and predictive ability. Physical Therapy in Sport, 6(2), 74-82.
- Markovic, G., Dizdar, D., Jukic, I., & Cardinale, M. (2004). Reliability and factorial validity of squat and countermovement jump tests. Journal of Strength and Conditioning Research, 18(3), 551-555.
- Macadam, P., Cronin, J. B., & Simperingham, K. D. (2017). The role of horizontal resistance training on the physical performance of team-sport athletes. Strength and Conditioning Journal, 39(5), 1-12.
- Buckthorpe, M., Morris, J., & Folland, J. P. (2012). Validity of vertical jump measurement devices. Journal of Sports Sciences, 30(1), 63-69.
- MAT Assessment. (2023). Power testing: broad jump protocol and norms.
- BrianMac Sports Coach. (2023). Standing long jump test.
- TopEnd Sports. (2024). Standing long jump test scores by sport.
- SimpliFaster. (2023). Testing protocol: jump-to-height ratio.
- Tomkinson, G. R., Carver, K. D., Atkinson, F., Daniell, N. D., Lewis, L. K., Fitzgerald, J. S., Lang, J. J., & Ortega, F. B. (2018). European normative values for physical fitness in children and adolescents aged 9-17 years: results from 2 779 165 Eurofit performances representing 30 countries. British Journal of Sports Medicine, 52(22), 1445-1456.
- Catley, M. J., & Tomkinson, G. R. (2013). Normative health-related fitness values for children: analysis of 85347 test results on 9-17-year-old Australians since 1985. British Journal of Sports Medicine, 47(2), 98-108.


