
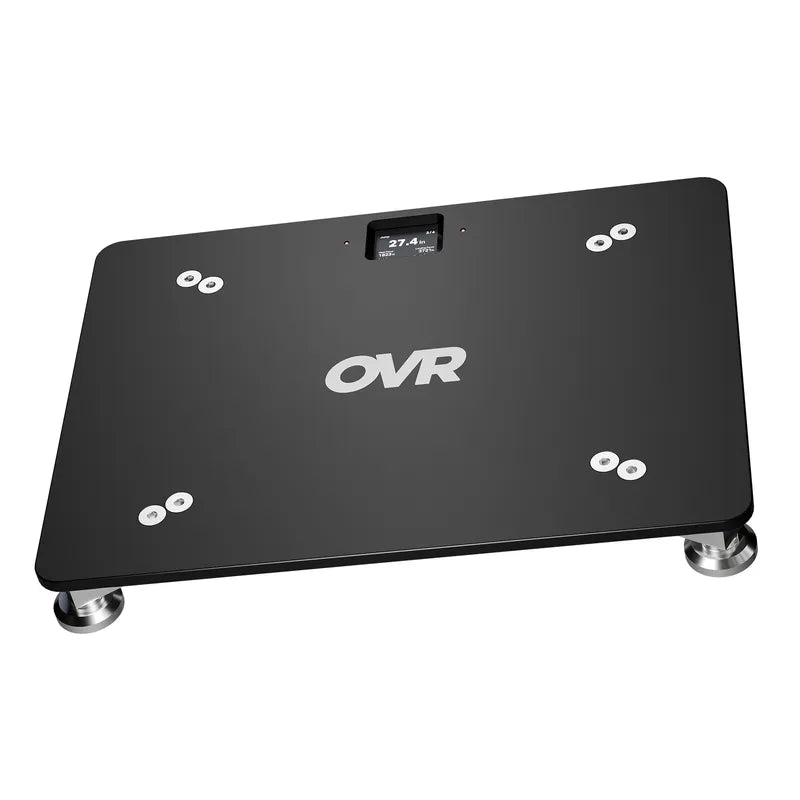


A 30-inch vertical doesn't tell you what to train next. Neither does a 4.6 forty or a 405 squat. A single number from a single test day is a snapshot, and a snapshot can mislead you as easily as it can inform you.
How the numbers compare often matters more than the numbers themselves. Two athletes can run the same 40, but a slow start and a slow top end are two different problems, and they need two different programs. Lay jump, sprint, and strength data side by side and the noise drops out, leaving a profile behind.
Over a decade of force-velocity profiling research has shown that athletes with similar performance outputs can have very different mechanical profiles, and that training matched to the profile tends to produce better outcomes than generic programming [1, 2]. The practical version of that idea is a jump, sprint, and velocity testing setup that captures data on the same athletes, so the relationships between the numbers are visible.
Why one test isn't enough
One test isn't enough to see those relationships. The three categories of testing each show something different about the athlete. Sprint timing shows how the athlete accelerates and how they hold speed. Jump testing shows how high they jump, how well they spring off the ground, and how short the contact is. Velocity testing shows how fast an athlete can move a load and how much power they produce doing it.
Each athlete has a different pattern of bar speed across different loads. Two athletes with the same 1RM can have very different velocities at 70%, and that difference reveals which athlete leans more toward strength and which one leans more toward speed [1, 2]. This is the underlying logic of velocity-based training, where bar speed informs how heavy a load actually is for a given athlete on a given day [4].
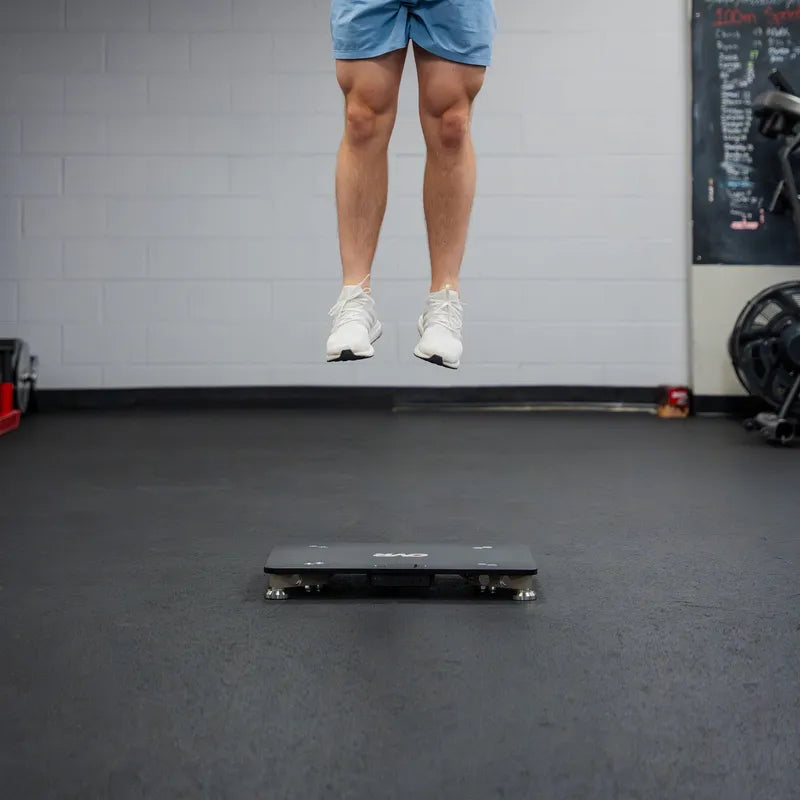
Jump testing adds a different kind of signal. A countermovement jump reflects total lower-body explosive output and shows meaningful relationships with relative strength, sprint speed, and change-of-direction ability across team-sport athletes [5, 11]. The reactive strength index from a drop jump shows how well the athlete uses the stretch-shortening cycle, the rapid stretch-then-shorten action that lets a muscle store and release elastic energy. Ground contact time shows how long the foot stays on the floor between landing and takeoff.
Sprint timing shows how those qualities translate to the ground. The 0-10 split is about explosive power and how quickly the athlete can apply force from a stationary start. The 10-30 segment is where the athlete continues to accelerate while transitioning from a forward-driving start posture toward upright sprinting mechanics. Anything past 30 yards is the max-velocity phase [6]. The pattern of splits tells the coach which phase is the limiter. Research on the way force gets applied during a sprint has shown that elite sprinters and hurdlers differ less in how much force they produce and more in how they apply it across the acceleration [7, 12].
A survey of Brazilian Olympic coaches found that 74% prioritized sprint speed testing and 63% prioritized power testing throughout the season, with most reporting that they relied more on multi-metric monitoring than single isolated tests [3].
Reading the patterns
Three combinations show up often enough to call by name, and after seeing them a few times they become easier to spot in the data. Two come from force-velocity profiling research. The third pulls from separate work on reactive strength and the stretch-shortening cycle.
The strength-dominant athlete. The squat is strong relative to bodyweight. But light-load velocities don't move as fast as the strength would predict, the vertical jump is lower than expected, and the first ten yards are slow. This athlete has the strength base but struggles to express it quickly. They tend to benefit from more work in the strength-speed and speed-strength zones, more loaded jumps, and more sprint starts. Adding more heavy strength work usually does less here because the strength is already there. What this athlete needs is the ability to apply it quickly. The force-velocity profiling literature would describe this athlete's training need as reducing a velocity deficit, where ballistic and velocity-oriented training tends to produce greater gains than additional maximal strength work [1, 8].
The speed-dominant athlete. Light loads move fast. The vertical jump looks promising. But max strength is below where it should be for an athlete with their power output, and the back end of the 40 holds up better than the start. This athlete has speed qualities but lacks the force base to support them at higher demands. They tend to benefit from heavier strength work, more compound lifts at higher loads, lower velocity loss caps, and patience while strength catches up. The force-velocity profiling literature would describe this athlete's training need as reducing a force deficit, where maximal strength training tends to produce greater gains than additional ballistic work [1, 8].
The reactive-deficient athlete. CMJ is fine. 1RM is fine. But RSI is low, ground contact times are long, and they struggle with multi-step plyos. This athlete can produce force but has trouble using the stretch-shortening cycle to recycle elastic energy. They tend to benefit from more depth jumps, more low-amplitude reactive work, and more sprint mechanics drills, with less time spent grinding heavy singles. The reactive strength literature describes this as a fast-SSC limitation, where targeted plyometric progressions tend to produce greater gains than additional strength or power work [13].
These three patterns cover a large share of what a coach actually sees. The diagnostic shortcut is that any single test struggles to identify which pattern an athlete fits. Data from at least two of the three categories starts to sort them, and three categories tends to give a coach enough to be confident. This is the same logic behind pairing the vertical jump with the broad jump for athletic testing. Different tests reveal different qualities.
Using the profile in practice
The point of profiling is to make different decisions for different athletes. Anything else (dashboards, reports, visualizations) is a byproduct of that goal.
The same logic applies in the weight room. A team with five strength-dominant linemen and three speed-dominant ones can run two different programs in the same session. The profile tells the coach which group each athlete falls into, and the velocity targets and rep schemes adjust from there [9]. Without the profile, everyone tends to get the same program, and only some of them improve.
The profile shifts emphasis within a program. A coach already running a four-day split with two lower-body sessions can keep the split, keep the exercise selection, and use the profile to decide which sets get high-intent ballistic targets, which sets get heavier loads with stricter velocity loss caps, and which athletes spend more time on plyos versus heavy singles. The profile tells the coach where to place the dose within the existing structure.
A profile works best as a guide for decisions that play out over weeks. A single bad day of testing rarely changes an athlete's profile. A pattern across two or three weeks of training does. Coaches who chase every dip in jump height or velocity end up reshuffling programs that were working. Coaches who skip the profile altogether end up running everyone through the same block. The middle ground is to look at trends across a few sessions before acting on what the profile says, and to trust the profile most when several metrics are pointing the same direction.
The other use case is tracking. Profiles shift over a training block. A four-week strength block tends to pull a speed-dominant athlete's profile toward the middle. A power-emphasis block tends to do the same for a strength-dominant athlete. When the profile fails to shift after a block of work, that's a signal worth paying attention to. It's more useful than any one test number on its own. The precision modern testing offers is what makes profile tracking practical [10].
Putting It Together
The value of testing comes from what the data tells the coach to do. The athletic profile turns three categories of testing into one coherent picture, and that picture is what makes individualization possible at scale. Some coaches read each test separately. Others combine them into a single composite score to profile athletes for at-a-glance comparisons across the board. Either approach gets the coach to the same place.
The principles hold across most contexts. Test enough times and across enough categories for a profile to take shape, so the data shows a pattern. Read across the tests when looking at the data, so the relationships between the numbers are visible. Match the program to what the athlete's profile is telling the coach. Re-test often enough to see whether the profile is shifting in the right direction.
| Principle | What It Means | Where to Start |
|---|---|---|
| Cover all three test categories | A profile needs jump, sprint, and strength data; the specific tests within each category can vary by sport and setup | Establish baselines across all three categories on the same athletes |
| Read across the tests together | The relationships between tests carry more information than any single number | Look at jump, sprint, and strength data alongside each other before making programming calls |
| Match programming to the profile | Strength-dominant and speed-dominant athletes benefit from different inputs | Sort athletes into groups within the same session |
| Trust trends across weeks | Profiles shift across weeks; one bad day rarely changes a profile | Wait for a pattern across two or three sessions before acting on the data |
| Track the profile over time | A profile shows trends that single tests can miss | Re-profile every 4 to 6 weeks during heavier training phases |
Coaches who profile their athletes across jump, sprint, and strength tend to make sharper programming decisions because they're working from a fuller picture. The data won't write the program on its own, but it tells the coach where to put the emphasis, when to wait for trends, and when the work is shifting things in the right direction.
References
-
Morin, J.B., & Samozino, P. (2016). Interpreting power-force-velocity profiles for individualized and specific training. International Journal of Sports Physiology and Performance, 11(2), 267-272.
-
Cormie, P., McGuigan, M.R., & Newton, R.U. (2011). Developing maximal neuromuscular power: Part 1 – biological basis of maximal power production. Sports Medicine, 41(1), 17-38.
-
Loturco, I., McGuigan, M.R., Freitas, T.T., Bishop, C., Zabaloy, S., Nakamura, F.Y., & Pereira, L.A. (2022). Strength and conditioning practices of Brazilian Olympic sprint and jump coaches. Journal of Human Kinetics, 81, 211-227.
-
González-Badillo, J.J., & Sánchez-Medina, L. (2010). Movement velocity as a measure of loading intensity in resistance training. International Journal of Sports Medicine, 31(5), 347-352.
-
Petrigna, L., Karsten, B., Marcolin, G., Paoli, A., D'Antona, G., Palma, A., & Bianco, A. (2025). Physical and biomechanical relationships with countermovement jump performance in team sports: Implications for athletic development and injury risk. Sports, 13(8), 277.
-
Haugen, T., & Buchheit, M. (2016). Sprint running performance monitoring: Methodological and practical considerations. Sports Medicine, 46(5), 641-656.
-
Cunha, A.A., Lima-Junior, D., Ribeiro, J.J., Cabral, L., Filho, A.G., & Aidar, F.J. (2020). Differences in the force velocity mechanical profile and the effectiveness of force application during sprint-acceleration between sprinters and hurdlers. Frontiers in Sports and Active Living, 2, 593238.
-
Jiménez-Reyes, P., Samozino, P., Brughelli, M., & Morin, J.B. (2017). Effectiveness of an individualized training based on force-velocity profiling during jumping. Frontiers in Physiology, 7, 677.
-
Suchomel, T.J., Nimphius, S., & Stone, M.H. (2016). The importance of muscular strength in athletic performance. Sports Medicine, 46(10), 1419-1449.
-
Weakley, J., Mann, B., Banyard, H., McLaren, S., Scott, T., & Garcia-Ramos, A. (2021). Velocity-based training: From theory to application. Strength and Conditioning Journal, 43(2), 31-49.
-
Lockie, R.G., Callaghan, S.J., Berry, S.P., Cooke, E.R., Jordan, C.A., Luczo, T.M., & Jeffriess, M.D. (2014). Relationship between unilateral jumping ability and asymmetry on multidirectional speed in team-sport athletes. Journal of Strength and Conditioning Research, 28(12), 3557-3566.
-
Samozino, P., Peyrot, N., Edouard, P., Nagahara, R., Jiménez-Reyes, P., Vanwanseele, B., & Morin, J.B. (2022). Optimal mechanical force-velocity profile for sprint acceleration performance. Scandinavian Journal of Medicine & Science in Sports, 32(3), 559-575.
-
Flanagan, E.P., & Comyns, T.M. (2008). The use of contact time and the reactive strength index to optimize fast stretch-shortening cycle training. Strength and Conditioning Journal, 30(5), 32-38.


