
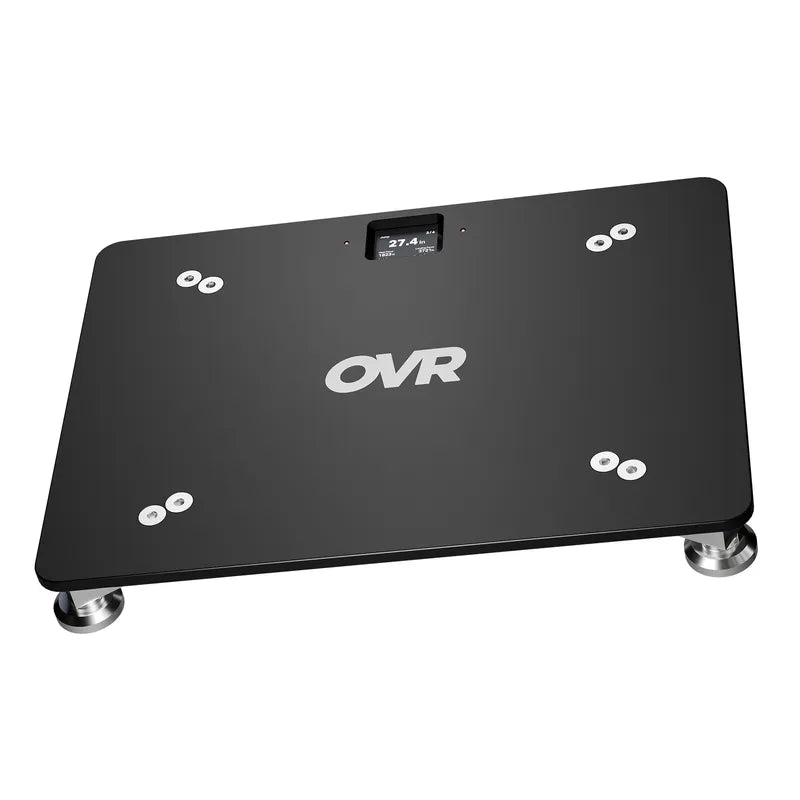


Most spec sheets list a force plate sampling rate of 1000 Hz. That number is how often the plate takes a force reading, one every millisecond, and it is the difference between a rate-of-force-development figure you can program off and one the software invented. The decisions a coach makes off force plates live inside events that last a few milliseconds, so the rate at which the plate captures those events decides whether the report you read is reliable. The honest version of this topic is not "every test needs 1000 Hz or your numbers are wrong." It is narrower and more useful: 1000 Hz is best for human movement, and it matters most on short, stiff events.
What a 1000 Hz sampling rate actually means
Sampling rate is how many force readings the plate records each second. At 1000 Hz the plate takes one reading every millisecond. At 100 Hz it takes one every ten milliseconds, which means nine out of every ten one-millisecond windows are never measured at all.
The plate never sees the whole force curve. It sees those individual readings, one dot per sample, and the software connects them to reconstruct everything that happened in between. At 1000 Hz the dots sit close together, so the line through them tracks the real movement closely. Drop to 100 Hz and they sit ten times farther apart, so more of the curve is guessed rather than measured. The fastest parts of a movement, the spike of a landing or the first instant of a pull, can rise and fall entirely inside one of those gaps, leaving out valuable data.
Why human force needs that many samples
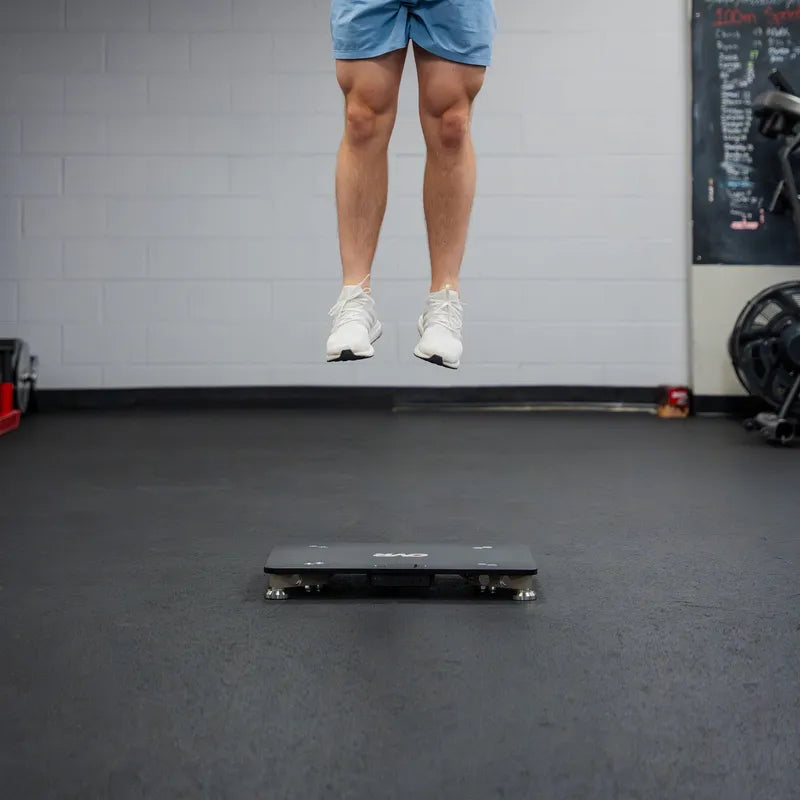
The events a coach cares about are fast. A jump push-off, a landing, the steep early climb of an isometric pull: these are where rate of force development and contact time live, and they happen in tens of milliseconds, not seconds. The same short ground-contact windows are what coaches measure to track reactive strength in plyometrics, so the rate that resolves them cleanly is the rate those numbers depend on. To capture a fast event you have to sample far faster than the event itself moves.
That is the practical reading of the Nyquist-Shannon theorem. To reconstruct a signal cleanly you have to sample at least twice as fast as the quickest thing happening in it. Sample slower than that and the fast movement you missed does not just vanish, the plate misreads it as a slower pattern that was never there. You get a clean-looking number that is simply wrong, and because the real movement was never recorded, nothing downstream can recover it. And twice as fast is the bare minimum. In practice the working rule is higher, five to ten times faster than the quickest movement you are tracking, because catching the real size of a peak, not just knowing one happened, takes extra samples on top. That sampling keeps it accurate.
This is the part that catches most people. A force trace looks like it moves slowly, so you would expect a few hundred samples a second to be plenty. For the overall shape, it would be. But the shape is not what decides your sampling rate. Two things do: how fast force can climb (rate of force development), and how precisely you can mark the instant it starts. Human muscle can fire off more than ten maximal force pulses per second, and reading those cleanly is why the research lands on at least 1 kHz for RFD. The overall trace looks calm, but the metrics a coach acts on come from its fast-changing parts. That is why RFD, rather than the slow shape of the curve, is what sets the 1000 Hz recommendation.
What you lose at a lower rate
Not every metric breaks the same way. Some survive a low rate fine, and others quietly degrade as the rate falls. Reading a spec sheet well means knowing which of your numbers sit in which bucket.
Survives a low rate. Peak force, force at a fixed time point, and impulse hold up well even when sampling drops. Impulse is the clearest example: it is the area under the force curve over a long window, so missing a few dots barely moves the total. One study found impulse reaches 90 percent of its true value at roughly 48 Hz. You are not going to sample that slowly, which is the point. Impulse is forgiving.
Rate-sensitive, breaks below about 500 Hz. Rate of force development, contact time, jump height, and any metric built on the timing of events all degrade as the rate falls, and the degradation is silent. Downsampling a countermovement jump force curve underestimates jump height against a 1000 Hz reference, and both common methods (impulse-momentum and flight time) drift the same way: about 0.1 to 0.2 cm at 500 Hz, 0.5 to 0.6 cm at 200 Hz, and 1.3 to 1.5 cm at 100 Hz. Rate of force development sits at the opposite end from impulse: where impulse stayed accurate down to roughly 48 Hz, RFD reads the steepest, fastest part of the curve and needs a far higher rate to come out right. Same plate, same jump, two numbers with very different sampling needs.
The reliability research splits the same way. Across sampling rates, CMJ peak power, peak force, and peak velocity stay reliable, but peak RFD does not. If you autoregulate off RFD or clear a return-to-play case on contact time and left-to-right symmetry, you are leaning on exactly the metrics that need the signal preserved at capture.
A higher sampling rate is not a cure-all, though. Even at 1000 Hz, rate of force development stays the most finicky number you report, because it also depends on where you set the onset threshold, how the signal is filtered, and how familiar the athlete is with the test. Faster sampling protects the raw signal, but it cannot rescue a metric that is sensitive to all of those other choices, so RFD is the number to standardize most carefully.
Why 1000 Hz is the floor, not a luxury
So 1000 Hz is the floor, but it should not be sold as a premium tier. It is simply the baseline that lets the decision-grade metrics survive capture, and it gives you room to filter the data sensibly without cutting into real signal, which is what keeps those false readings out in the first place.
For the testing most coaches do, going above 1000 Hz adds very little. Higher rates only matter for specialized impact-mechanics research, which is a different job from jump testing, sprint monitoring, and return-to-play screening with a squad, so it is not something to pay extra for. Match the standard, then stop optimizing the number and start optimizing your protocol, because day-to-day reliability comes mostly from setup, athlete familiarity, and consistent test execution.
This is also why sampling rate and accuracy are not the same conversation. Sampling rate is how often the plate reads force. Accuracy is how close each reading is to the true value. A plate can be fast and inaccurate, or accurate and too slow to catch RFD. Whether you can trust a contact-time number depends on the timing being preserved, which is a sampling question, not an accuracy one. Keep them separate when you read a spec sheet, as they are two of the specs that set plates apart.
Sources
- Maffiuletti NA, Aagaard P, Blazevich AJ, Folland J, Tillin N, Duchateau J (2016). "Rate of force development: physiological and methodological considerations." European Journal of Applied Physiology 116(6):1091-1116: https://pmc.ncbi.nlm.nih.gov/articles/PMC4875063/
- Hori N, Newton RU, Kawamori N, McGuigan MR, Kraemer WJ, Nosaka K (2009). "Reliability of performance measurements derived from ground reaction force data during countermovement jump and the influence of sampling frequency." Journal of Strength and Conditioning Research 23(3):874-882: https://pubmed.ncbi.nlm.nih.gov/19387390/
- Renner KE, Peebles AT, Socha JJ, Queen RM (2022). "The impact of sampling frequency on ground reaction force variables." Journal of Biomechanics 135:111034: https://experts.azregents.edu/en/publications/the-impact-of-sampling-frequency-on-ground-reaction-force-variabl/
- Gruber AH, Edwards WB, Hamill J, Derrick TR, Boyer KA (2017). "A comparison of the ground reaction force frequency content during rearfoot and non-rearfoot running patterns." Gait & Posture 56:54-59: https://www.sciencedirect.com/science/article/abs/pii/S0966636217301704
- Antonsson EK, Mann RW (1985). "The frequency content of gait." Journal of Biomechanics 18(1):39-47: https://pubmed.ncbi.nlm.nih.gov/3980487/
- "Sampling rate influence on vertical jump height in force plate analysis." Procedia Engineering (ScienceDirect): https://www.sciencedirect.com/science/article/pii/S1877705810004534
- McMahon J. "A guide to using force plates in sports performance." Sportsmith: https://www.sportsmith.co/articles/guide-to-using-force-plates-in-sports-performance/
- "Filtering Biomechanical Signals in Movement Analysis," PMC8271607: https://pmc.ncbi.nlm.nih.gov/articles/PMC8271607/
- Nyquist-Shannon sampling theorem: https://en.wikipedia.org/wiki/Nyquist%E2%80%93Shannon_sampling_theorem
- ScienceDirect Topics, "Sampling Rate": https://www.sciencedirect.com/topics/engineering/sampling-rate
- DATAQ, "What You Really Need to Know About Sample Rate": https://www.dataq.com/data-acquisition/general-education-tutorials/what-you-really-need-to-know-about-sample-rate.html
- "Effect of Sampling Frequency on a Unilateral Isometric Hamstring Strength Assessment Using Force Plates." Journal of Science in Sport and Exercise (2024): https://link.springer.com/article/10.1007/s42978-024-00277-w
- "Effect of Sampling Frequency on Isometric Midthigh-Pull Kinetics": https://pubmed.ncbi.nlm.nih.gov/26217049/
- MDPI Sensors 23(9):4437: https://www.mdpi.com/1424-8220/23/9/4437


