
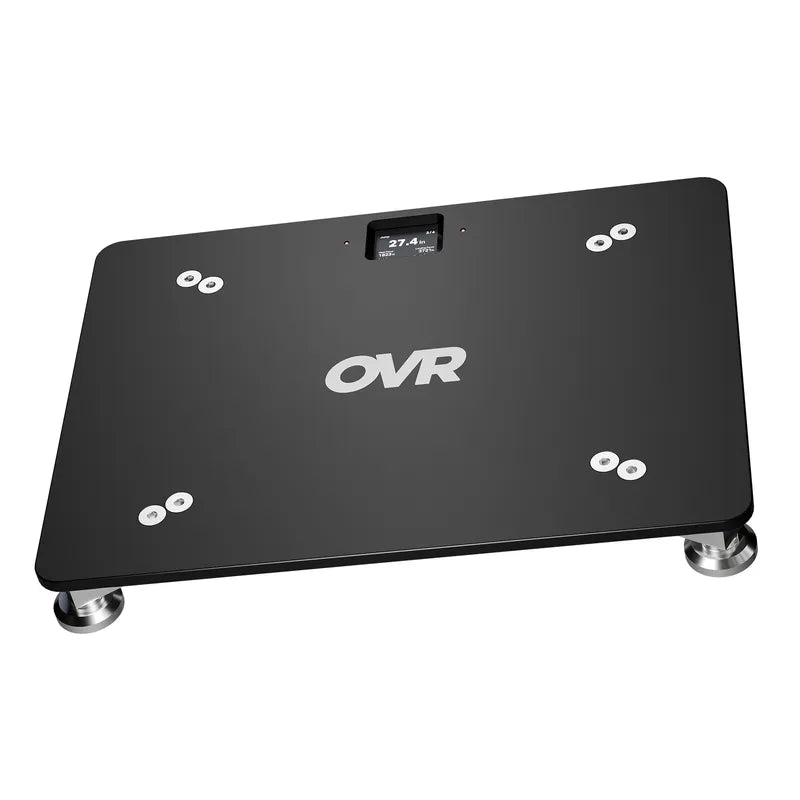
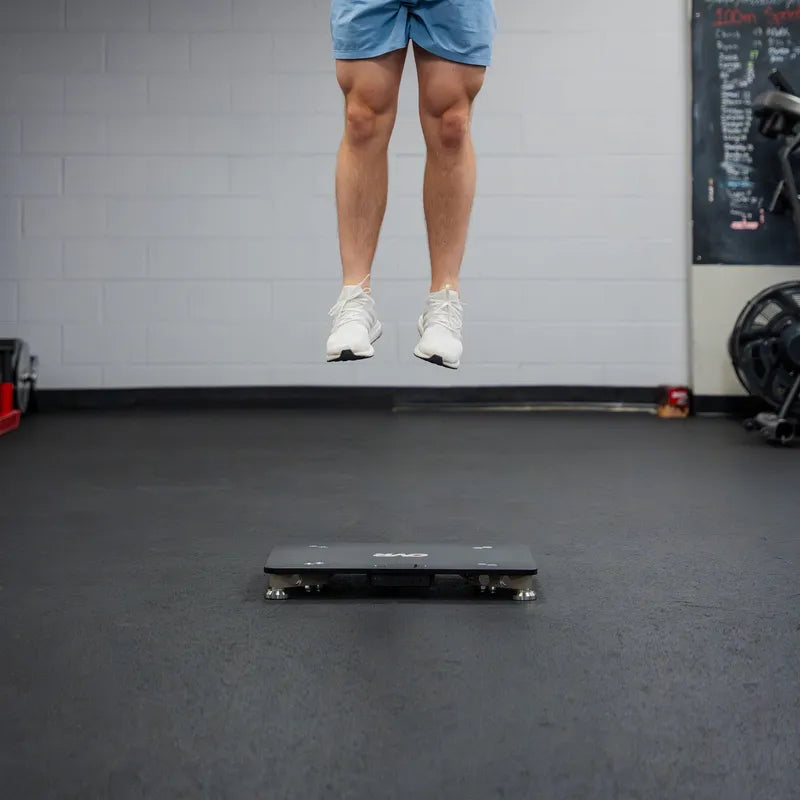


The isometric mid-thigh pull (IMTP) is a strength test: the athlete stands on a force plate and pulls as hard as they can against a fixed bar. The headline number is peak force, the hardest pull they produce. A 3.0 net ×BW pull (three times bodyweight, after the athlete's own weight is taken out) means different things depending on who is on the plate. For a high school athlete it is exceptional, near the top of the range. For a collegiate male it is solid, in the good range. For a senior powerlifter it is below what the platform demands. This post gives IMTP benchmarks for both sexes from high school through pro, in the net ×BW scale a plate reads off the device. If you test athletes on force plates, it is the context that turns a single result into a decision.
A note on these numbers: These benchmarks come from peer-reviewed IMTP literature. Most published work reports gross peak force (N/kg), so the net ×BW bands below are conversions of that data plus OVR's reference set, not a single peer-reviewed net-×BW paper. The average and good ranges reflect what typical athletes at each level produce. The elite tier reflects the rare top end, including strength-sport athletes like weightlifters and powerlifters, who sit well above team-sport norms. Where published data is thin, some ranges are estimated from adjacent populations. As with any benchmark, treat these as reference ranges, not hard cutoffs, and keep in mind that results only compare cleanly when the testing setup is the same.
Where the Average Athlete Actually Stands
All values are net relative peak force in multiples of bodyweight (net ×BW): peak force with the athlete's own weight subtracted, then divided by bodyweight so athletes of different sizes compare fairly. It is what OVR Force reads off the device. Published studies usually report a different unit (gross N/kg); mixing the two breaks the comparison, which Understanding Your Numbers sorts out below.
Males (net ×BW)
| Level | Average | Good | Advanced | Elite |
|---|---|---|---|---|
| High School (14–18) | 1.5–2.2 | 2.2–2.6 | 2.6–3.2 | 3.2+ |
| Collegiate | 2.0–2.8 | 2.8–3.3 | 3.3–3.8 | 3.8+ |
| Pro / Elite (incl. strength sport) | 2.8–3.4 | 3.4–3.9 | 3.9–4.3 | 4.3+ |
Females (net ×BW)
| Level | Average | Good | Advanced | Elite |
|---|---|---|---|---|
| High School (14–18) | 1.3–1.9 | 1.9–2.3 | 2.3–2.8 | 2.8+ |
| Collegiate | 1.7–2.4 | 2.4–2.9 | 2.9–3.4 | 3.4+ |
| Pro / Elite (incl. strength sport) | 2.4–3.0 | 3.0–3.5 | 3.5–3.9 | 3.9+ |
Any athlete in a serious strength program for over a year should sit at good or above for their level. The elite tier is where strength-sport athletes live: trained weightlifters and powerlifters routinely land in the 3.5 to 4.7 net ×BW range for men and 3.1 to 4.2 for women, with international lifters higher still. That is why the pro and elite bands run high. A strong team-sport pro will read average to good here, not elite, and that is the correct read.
Understanding Your Numbers
Get the unit right first. Gross peak force is the total force on the plate, including the weight of just standing on it. Net peak force takes that bodyweight out, leaving only the force the athlete added by pulling, and OVR Force reports it divided by bodyweight (net ×BW). Compare a gross study number to a net number off your plate and the athlete looks about a full bodyweight weaker than they are.
Always compare on relative force, not raw Newtons. A 90 kg athlete and a 70 kg athlete both producing 3000 N are at 3.4 and 4.4 times bodyweight in total force; the smaller one is far stronger for their size. This is also where the male-female comparison gets misread. In raw Newtons the gap is large, because the average man carries more muscle. In relative force it shrinks sharply, and when men and women are matched for strength the difference all but disappears. One study of 63 athletes measured relative peak force at 25.37 versus 25.39 N/kg, effectively identical, with early-window force nearly identical too. The female bands sit a little lower at the squad-average level, but they are close to the male bands.
Not every number is equally trustworthy. Peak force is the most dependable, returning nearly the same result on repeat tests (ICC 0.96 to 0.99, about 3 to 4 percent variation), and force at fixed early time points holds up well too. Rate of force development (RFD), how fast force climbs in the first instant, is the exception: on portable plates it comes back less reliable at every time point, so read it as a trend across sessions, not a benchmark to hit.
A benchmark only holds up when the setup matches the one it came from. Hip angle is the biggest culprit (the standard sits near 145 degrees, knee 125 to 145). The clean comparison is an athlete against their own prior tests on one setup, one device, one body position.
What to Do With a Benchmark
A relative peak force number points to one of two problems. Sit low on the band and the limiter is maximal strength: run a strength block, heavy compound work to raise the ceiling. Sit high on peak force but produce little force in the first instant and the ceiling is fine; the limiter is how fast they reach it, which calls for ballistic and plyometric work (jumps, throws), not more heavy pulling.
The dynamic strength index (DSI) bridges the number and the decision. It divides countermovement jump peak force by IMTP gross peak force: a low DSI means strong but not explosive (lean ballistic), a high DSI means explosive but strength-limited (lean maximal strength). Treat the thresholds as guidance, not hard cutoffs. The IMTP is one input in a complete athletic profile alongside jump and sprint data, and pairing it with a jump test is how power versus strength becomes a programming input instead of a guess.
A strong IMTP tells you a lot about an athlete's squat and cutting ability, and less about their top-end speed, where how fast they apply force matters more than how much. Read it as a strength number, not a speed one.
The number is a starting point. A one-time read carries a wide error bar and says nothing about whether training is working. What changes across a block, measured the same way each time, is the real signal. Lock the protocol, retest on the same device and position, and watch the trend.
References
- Comfort, P., Dos'Santos, T., Beckham, G. K., Stone, M. H., Guppy, S. N., & Haff, G. G. (2019). Standardization and methodological considerations for the isometric mid-thigh pull. Strength and Conditioning Journal, 41(2), 57–79.
- Lum, D., Haff, G. G., & Barbosa, T. M. (2020). The relationship between isometric force-time characteristics and dynamic performance: A systematic review. Sports, 8(5), 63.
- Dos'Santos, T., Thomas, C., Comfort, P., McMahon, J. J., & Jones, P. A. (2017). Relationships between isometric force-time characteristics and dynamic performance. Sports, 5(3), 68.
- Brady, C. J., Harrison, A. J., & Comyns, T. M. (2020). Isometric mid-thigh pull performance in rugby players: A systematic literature review. Journal of Functional Morphology and Kinesiology, 5(4), 91.
- Normative data and objective benchmarks for selected force plate tests for professional and youth soccer players in the English Football League. (2025). Journal of Sports Sciences.
- Test-retest reliability of isometric mid-thigh pull maximum strength assessment: A systematic review. (2022). Sports Medicine - Open.
- Intra-trial reliability and usefulness of isometric mid-thigh pull testing on portable force plates. (2020). PMC7052723.
- Test-retest reliability of a single isometric mid-thigh pull protocol. (2024). PeerJ, 12, e17951.
- Bruno, J., Montoro-Bombú, R., Thapa, R. K., & Sarmento, H. (2025). Reliability of the isometric mid-thigh pull for maximal strength testing in youth athletes: A systematic review. International Journal of Sports Science and Coaching.
- Within- and between-session reliability of the isometric mid-thigh pull in young female athletes. (2018). PMC6014879.
- O'Dowd Hill, Lodge, C., & Browne, D. (2021). Reliability of the isometric mid-thigh pull peak force in Irish schoolboy rugby players. South African Journal of Sports Medicine.
- Wang, R., Hoffman, J. R., et al. (2016). Isometric mid-thigh pull correlates with strength, sprint, and agility performance in collegiate rugby union players. Journal of Strength and Conditioning Research.
- Thomas, C., & Dos'Santos, T. Relationship between isometric mid-thigh pull variables and sprint and change of direction performance in collegiate athletes. Salford repository.
- Relationship between isometric mid-thigh pull force, sprint acceleration mechanics, and performance in national-level track and field athletes. (2025). Applied Sciences, 15(3), 1089.
- Beckham, G., et al. Relationship of maximum strength to weightlifting performance.
- Identifying a test to monitor weightlifting performance in competitive male and female weightlifters. (2018). Sports, 6(2), 46.
- Scaling isometric mid-thigh pull maximum strength in Division I athletes: Are we meeting the assumptions? (2018). PubMed 30102119.
- The isometric mid-thigh pull in basketball: An effective predictor of sprint and jump performance in male, adolescent players. (2020). International Journal of Sports Physiology and Performance, 15(3), 409.
- Driveline Baseball. (2020). Isometric mid-thigh pull (IMTP) strength testing (net vs gross peak force definition).
- Science for Sport. Isometric mid-thigh pull (IMTP) overview: protocol, joint angles, reliability.
- Science for Sport. Rate of force development (RFD) overview: time windows and peak RFD.
- Comeau, M. J., et al. (2017). A comparison of dynamic strength index between team-sport athletes. Sports, 5(3), 71.
- Relative strength explains the differences in multi-joint rapid force production between sexes. (2024). PMC10868802.
- Effect of hip joint angle on isometric mid-thigh pull kinetics. (2017). PubMed 28933711.


