
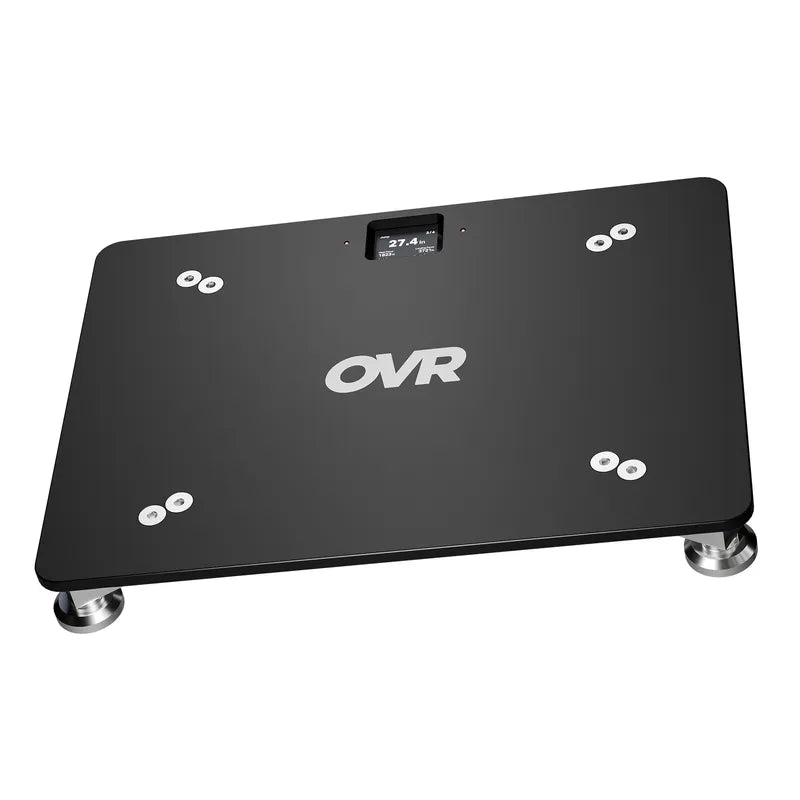
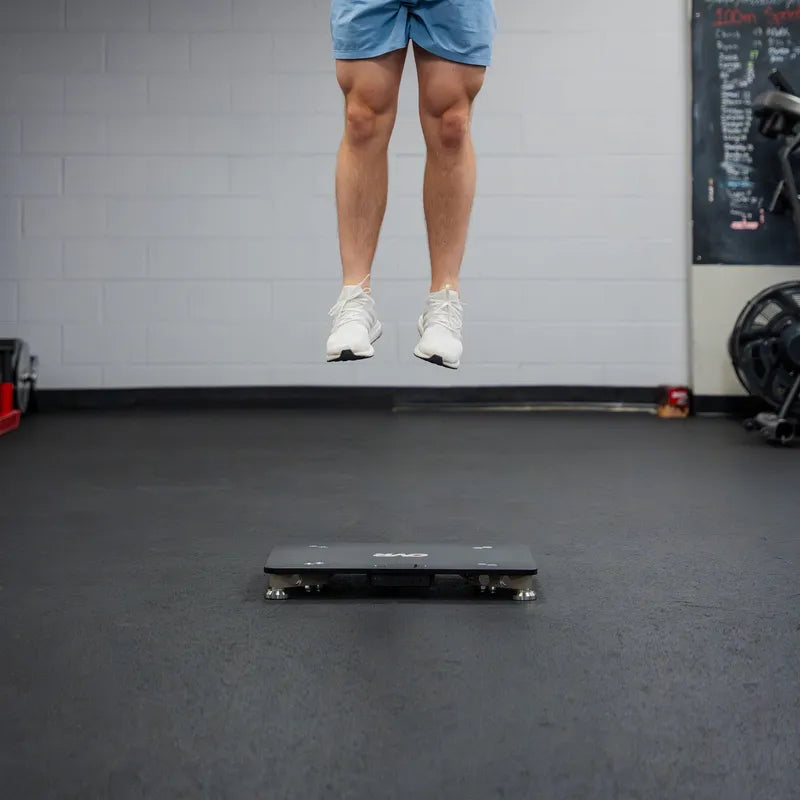


Velocity zones sort resistance training by how fast the bar actually moves, using average bar speed on the way up instead of a percentage of a one-rep max. Each zone maps to a training quality, from maximal strength at low speeds to explosive starting strength at high ones. The reason coaches use them: bar speed reflects what an athlete can do today, while a percentage reflects a max that was tested weeks ago. A barbell velocity tracker puts that number on a display after every rep, which is what makes zone-based programming practical in a live session.
Velocity-based training treats bar speed as the primary input for prescribing and monitoring load [8, 11]. The reason it works is the load-velocity relationship. For a given lift and athlete, bar speed falls as load rises in a predictable pattern, roughly linear across most of the working range. Foundational work on the bench press found the fit tight enough to estimate relative load from velocity alone across that range [1]. Light loads move fast, heavy loads move slow, and the same speed on two different days points to roughly the same relative intensity. That is the argument for training bar speed over percentages.
The five velocity zones
OVR uses five zones based on average bar speed [12]. Zone systems vary between references, but they all carve the load-velocity range into speed bands tied to a training quality [9, 10].
- Absolute strength, under 0.50 m/s, roughly 80 to 100 percent of your max. Program it to build maximal strength. Here you teach your body to call on more muscle at once and contract it harder, so your whole strength base shifts up.
- Accelerative strength, 0.50 to 0.75 m/s, roughly 60 to 85 percent. Program it to get strong by pushing heavy loads fast. This is the zone most coaches live in for building strength: you learn to accelerate a heavy bar instead of grinding it.
- Strength-speed, 0.75 to 1.00 m/s, roughly 40 to 70 percent. Program it to build strength and speed together. It trains rate of force development, so you put out more force in less time and heavier loads move faster.
- Speed-strength, 1.00 to 1.30 m/s, roughly 20 to 50 percent. Program it to develop rapid force at light loads. Your muscles fire faster, so you reach higher speeds when the load is light.
- Starting strength, above 1.30 m/s, roughly below 20 percent. Program it to build drive off a dead stop. It trains the force you create in the first instant, so you overcome inertia faster.
The percentage ranges overlap on purpose. What counts as 70 percent on a squat does not move at the same speed as 70 percent on a bench, so the zone, not the percentage, is the thing to program around. The zones are just the split between strength and power sorted by bar speed instead of by percentage.
Why a zone beats a percentage on the day
A percentage assumes the number you tested still holds. It rarely does. An athlete who maxed at 405 six weeks ago might be stronger now, or might have slept four hours and be down 8 percent today. Prescribing a flat 80 percent hands them the wrong load in both cases.
A velocity target adjusts on its own. If the plan is accelerative strength work at 0.50 to 0.75 m/s, the athlete loads the bar until the first rep lands in that range, and the load floats to match how they actually moved that day. Systematic review work comparing velocity-based and percentage-based programming has reported comparable or better strength and power outcomes from the velocity approach, without needing a fresh max test to set the load [2, 3]. In practice this means reading bar speed rep to rep and letting the first rep of the set fix the day's load.
Velocity also flags fatigue before the athlete feels it. Bar speed at a fixed load declines as neuromuscular fatigue builds, and that decline tracks closely with metabolic fatigue markers like blood lactate [4]. A squad-wide slowdown on Monday is a signal to pull back rather than push on.
Running a zone in a real session
Which zones you lean on shifts across the calendar. In the off-season, the priority is a bigger base, so most work sits in the absolute and accelerative strength zones under 0.75 m/s, building the force ceiling everything else draws on. Heading into the pre-season, the emphasis moves up the range into strength-speed and speed-strength, turning that base into power the athlete can express fast. In-season, the goal is to stay explosive without piling up fatigue, so sessions lean on lighter, faster work in the speed-strength and starting strength zones, holding bar speed high while volume drops.
Inside a session, the mechanics are the same in any zone. The athlete loads the bar until the first rep lands in the target range, and the load floats to match how they moved that day. Keep the reps crisp, and on power work cap the drop-off tight so the set stays fast. That drop-off is velocity loss within the set, and holding it near 10 percent keeps the stimulus where you want it instead of drifting into slow, grinding reps. The screen does the math: the athlete chases the number, the coach watches the zone, and nobody recalculates a percentage mid-session. One zone and one loss cap per lift is usually enough to run a session cleanly.
Where the zones blur
The five zones are guidelines and two things move the boundaries.
The first is the exercise. The same relative load moves at different speeds on different lifts: a heavy deadlift, with no eccentric to rebound out of, is slower than a squat at the same percentage, and the bench is slower still. Even within one lift, the sticking point shifts the velocity [5]. So the same 0.45 m/s means different things depending on the movement, and the zone should be read in that context.
The second is the individual. Zone boundaries are population averages, and one athlete's true speed at a given percent can differ enough from a teammate's to land the same load in a neighboring band [6]. The fix is a load-velocity profile. Test a handful of loads in one session, plot speed against load, and you get that athlete's personal map from velocity to intensity. If you use the OVR Connect app, it builds that profile for you, though it needs at least three sessions before it returns any data. Profiles built from several loads hold up better than any single-rep estimate, and they show when someone is force-deficient or velocity-deficient instead of leaving you to guess [7].
Zones give a whole program a shared language on day one. Profiles sharpen that language athlete by athlete over a block. Start every lift with a zone and a loss cap, and the bar speed on the screen becomes a training decision, from the set in front of you to the whole training calendar.
Sources
- González-Badillo JJ, Sánchez-Medina L. Movement Velocity as a Measure of Loading Intensity in Resistance Training. International Journal of Sports Medicine, 2010: https://pubmed.ncbi.nlm.nih.gov/20180176/
- Effects of Velocity-Based Training vs. Traditional 1RM Percentage-Based Training on Strength, Jump, Sprint and Change-of-Direction Performance: A Systematic Review with Meta-Analysis. PMC, 2021: https://pmc.ncbi.nlm.nih.gov/articles/PMC8601436/
- Effects of Velocity-Based Training on Strength and Power in Elite Athletes: A Systematic Review. PMC, 2021: https://pmc.ncbi.nlm.nih.gov/articles/PMC8156188/
- Sánchez-Medina L, González-Badillo JJ. Velocity Loss as an Indicator of Neuromuscular Fatigue during Resistance Training. Medicine & Science in Sports & Exercise, 2011: https://www.semanticscholar.org/paper/Velocity-loss-as-an-indicator-of-neuromuscular-S%C3%A1nchez-medina-Gonz%C3%A1lez-Badillo/36c8d09feb190606337a2210f22dde4698f64875
- Range of Motion and Sticking Region Effects on the Bench Press Load-Velocity Relationship. PMC, 2019: https://pmc.ncbi.nlm.nih.gov/articles/PMC6873133/
- Movement Velocity Can Be Used to Estimate the Relative Load during the Bench Press and Leg Press Exercises. PMC, 2019: https://www.ncbi.nlm.nih.gov/pmc/articles/PMC6707344/
- Weakley J, et al. Velocity-Based Training: From Theory to Application. Strength & Conditioning Journal, 2021: https://journals.lww.com/nsca-scj/fulltext/2021/04000/velocity_based_training__from_theory_to.4.aspx
- Velocity-Based Training. Science for Sport: https://www.scienceforsport.com/velocity-based-training/
- Velocity-Based Training Zones Explained. GymAware: https://gymaware.com/velocity_zones/
- How to Train with Specific Velocity Zones. Vitruve: https://vitruve.fit/blog/velocity-based-training-for-specific-velocity-zones/
- What Is Velocity-Based Training? Sportsmith: https://www.sportsmith.co/articles/what-is-velocity-based-training/
- OVR Performance VBT Training Guide (internal reference), velocity zones section.


