
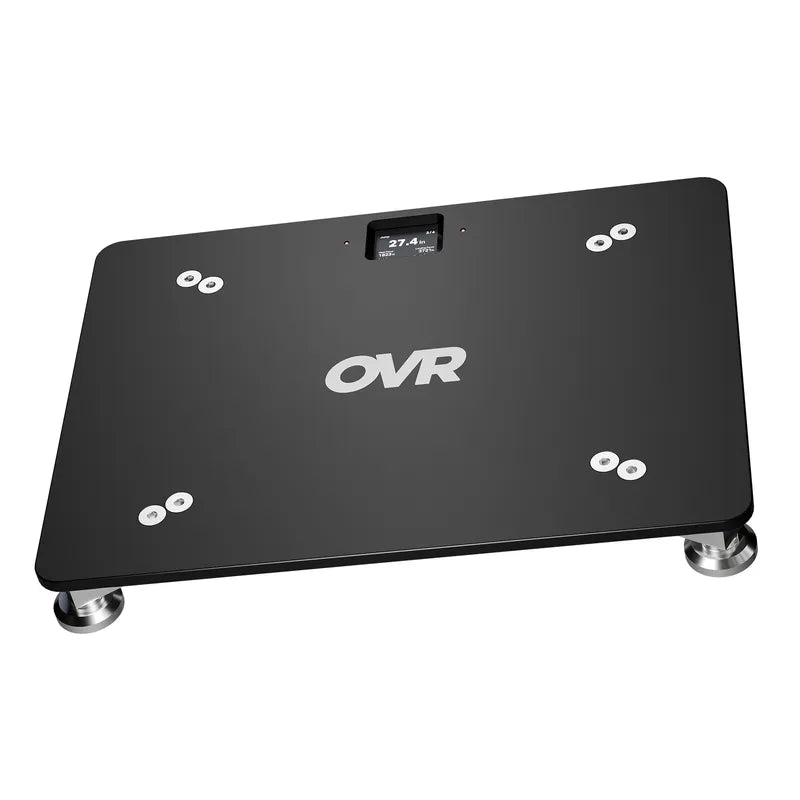
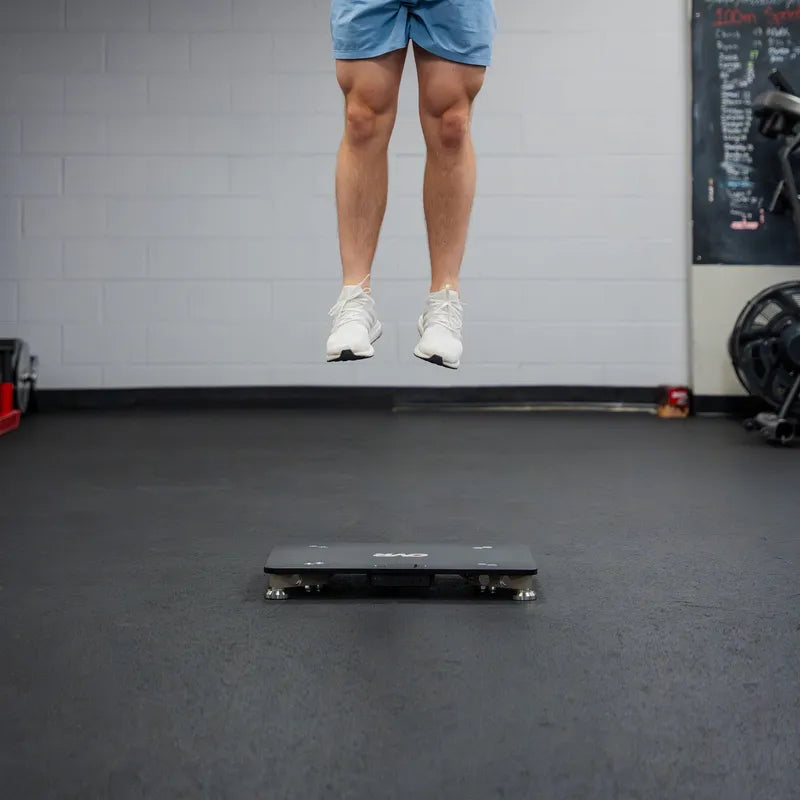


A countermovement jump (CMJ) is a vertical jump where the athlete dips down fast and then jumps straight up with hands on hips. On a force plate it gives you multiple metrics: how high the athlete jumps (jump height), how much power they put into it (peak power), and how quickly they leave the ground. This post benchmarks the metric with the strongest published norms, jump height, across age, sport, and competition level, drawn from peer-reviewed force-plate studies and published reference datasets. A force plate captures all of it from one jump, which lets a coach compare a test against the right group of athletes instead of guessing.
A note on these numbers: Every figure below comes from peer-reviewed force-plate research, measured with the athlete's hands on the hips. The named figures in the sport sections each trace to a specific study. The four-band grids pull from several studies, with practitioner thresholds and development curves filling the gaps where published data is thin, with some values extrapolated from the closest comparable group rather than guessed. Treat them as a strong starting point, not official population norms.
One adjustment to know about: published studies report ballistic jump height, the airborne-only value, so we run every figure through one fixed conversion to put it on the true center-of-mass scale, the way OVR Force reads a jump. That changes the scale, not the source: each number still starts from the same published figure it always did. Read each band against the group, sport, and test setup it came from, then track the athlete against their own past results.
Where the Average Athlete Actually Stands
It helps to know what separates the two jump-height numbers mentioned above. Ballistic jump height counts only the airborne part of the jump, how far the center of mass rises from the instant the feet leave the ground to the top of the jump, treating the body as a projectile. True center-of-mass jump height counts the full vertical travel of the center of mass, including the height it gains during the final push-off, while the feet are still driving into the ground and the ankles, knees, and hips finish extending. That last push lifts the center of mass before takeoff, so the ballistic number always sits a little below the true center-of-mass number for the same jump.
The grids below cover the four bands from average to elite, for both men and women, from middle school through professional. The gains are steepest from middle school into high school, where puberty does most of the work, then continue more gradually into the college and professional ranks as weaker jumpers are filtered out and training accumulates. Start here before going sport by sport.
Males
| Level | Average | Good | Advanced | Elite |
|---|---|---|---|---|
| Middle School (12-14) | 11.7-14.9 in (30-38 cm) | 14.9-17.0 in (38-43 cm) | 17.0-19.2 in (43-49 cm) | 19.2+ in (49+ cm) |
| High School (14-18) | 17.0-19.2 in (43-49 cm) | 19.2-21.3 in (49-54 cm) | 21.3-22.4 in (54-57 cm) | 22.4+ in (57+ cm) |
| College (18-23) | 18.1-20.2 in (46-51 cm) | 20.2-22.4 in (51-57 cm) | 22.4-23.5 in (57-60 cm) | 23.5+ in (60+ cm) |
| Professional (22+) | 19.2-21.3 in (49-54 cm) | 21.3-23.5 in (54-60 cm) | 23.5-24.5 in (60-62 cm) | 24.5+ in (62+ cm) |
Females
| Level | Average | Good | Advanced | Elite |
|---|---|---|---|---|
| Middle School (12-14) | 9.6-11.7 in (24-30 cm) | 11.7-13.8 in (30-35 cm) | 13.8-16.0 in (35-41 cm) | 16.0+ in (41+ cm) |
| High School (14-18) | 12.8-14.9 in (32-38 cm) | 14.9-17.0 in (38-43 cm) | 17.0-18.1 in (43-46 cm) | 18.1+ in (46+ cm) |
| College (18-23) | 13.8-16.0 in (35-41 cm) | 16.0-18.1 in (41-46 cm) | 18.1-19.2 in (46-49 cm) | 19.2+ in (49+ cm) |
| Professional (22+) | 14.9-17.0 in (38-43 cm) | 17.0-19.2 in (43-49 cm) | 19.2-20.2 in (49-51 cm) | 20.2+ in (51+ cm) |
Girls stop gaining earlier than boys, around 12 to 13 years against the male curve that runs into the late teens, so the female middle-school band sits well below the high-school row. These are the main reference grids. Most sports track them closely, as the next section explains.
Sport-by-Sport CMJ Benchmarks
On a hands-on-hips force-plate CMJ, most team sports cluster around the general bands above. The large sport-to-sport spread you see in vertical-jump-with-arms charts does not show up here, because arm swing and reach-and-jump setups inflate some sports more than others, and removing them flattens the field. Only jumping events separate out clearly: track sprinters and jumpers test above the general grids. Everyone else maps onto them, with the spread between positions inside a sport often as wide as the spread between levels.
Jumping Events (Track Sprints and Jumps)
Track sprinters and jumpers hold the highest sourced CMJ values in this post, all hands-on-hips: male sprinters 21.6 in (55.0 cm), male high jumpers 20.1 in (51.0 cm), female sprinters 17.7 in (45.0 cm), female high jumpers 16.0 in (40.7 cm). Those means land in the College rows of the grids below. Distance runners test below these rows, closer to the general bands.
Men (sprint and jump events)
| Level | Average | Good | Advanced | Elite |
|---|---|---|---|---|
| Middle School (12-14) | 12.8-16.0 in (32-41 cm) | 16.0-19.2 in (41-49 cm) | 19.2-21.3 in (49-54 cm) | 21.3+ in (54+ cm) |
| High School (14-18) | 18.1-20.2 in (46-51 cm) | 20.2-22.4 in (51-57 cm) | 22.4-24.5 in (57-62 cm) | 24.5+ in (62+ cm) |
| College (18-23) | 19.2-21.3 in (49-54 cm) | 21.3-23.5 in (54-60 cm) | 23.5-25.6 in (60-65 cm) | 25.6+ in (65+ cm) |
| Elite / Pro | 20.2-22.4 in (51-57 cm) | 22.4-24.5 in (57-62 cm) | 24.5-26.7 in (62-68 cm) | 26.7+ in (68+ cm) |
Women (sprint and jump events)
| Level | Average | Good | Advanced | Elite |
|---|---|---|---|---|
| Middle School (12-14) | 10.6-12.8 in (27-32 cm) | 12.8-14.9 in (32-38 cm) | 14.9-17.0 in (38-43 cm) | 17.0+ in (43+ cm) |
| High School (14-18) | 14.9-17.0 in (38-43 cm) | 17.0-19.2 in (43-49 cm) | 19.2-20.2 in (49-51 cm) | 20.2+ in (51+ cm) |
| College (18-23) | 16.0-18.1 in (41-46 cm) | 18.1-20.2 in (46-51 cm) | 20.2-21.3 in (51-54 cm) | 21.3+ in (54+ cm) |
| Elite / Pro | 17.0-19.2 in (43-49 cm) | 19.2-21.3 in (49-54 cm) | 21.3-22.4 in (54-57 cm) | 22.4+ in (57+ cm) |
High jumpers sit toward the top of any level. The sourced sprint and high-jump means above fall inside the College rows of these grids.
Team and Field Sports
Team and field sports track the general grids in the first section. There is no separate table for each one, because on a hands-on-hips force plate they do not pull apart the way arm-swing charts suggest. What follows is the sourced position and level anchor for each, in plain voice, so a coach can see where the real data lands on the general bands.
Basketball. From D-I men's force-plate CMJ data: guards 19.1 in (48.4 cm), forwards 17.9 in (45.4 cm), centers 17.3 in (43.9 cm). Guards jump highest, centers lowest, with centers putting out more raw power but less power per kilo of body weight. Guards reach the general College band; forwards and centers land a level down, around high school. That is the point: a hands-on-hips CMJ does not single basketball out the way a reach-and-jump dunk test would.
Soccer. The age data here is the cleanest in the literature, all male soccer players measured the same way: U12 11.7 in (29.7 cm), U14 14.7 in (37.3 cm), U16 17.3 in (43.9 cm), U18 19.3 in (49.0 cm), adult 19.7 in (50.0 cm). That curve climbs steadily through the general male grid as players mature, from the middle-school bands up into the College bands by adulthood. Women's soccer tracks the general female grid.
Rugby. From professional force-plate data: men's rugby league backs 17.4 in (44.1 cm) and forwards 16.4 in (41.7 cm), Women's Rugby World Cup backs 17.8 in (45.2 cm, 23.8 W/kg) and forwards 16.0 in (40.7 cm, 20.2 W/kg). Backs jump higher; forwards win on takeoff momentum (how much mass they drive into the ground) because they are heavier, which is exactly what a coach wants from a forward. Both land within the general bands, below the jumping-event athletes, because raw jump height is not what rugby selects for.
Baseball. Baseball is a rotational sport, and CMJ shows no real shift from the general bands. Vertical jump correlates with the lower-body power behind throwing velocity and bat speed, which is why coaches test it even though the sport itself is not a jumping sport.
Hockey. Hockey tracks the general bands. The reliability example comes from elite female ice hockey players, where a real change in CMJ height meant a jump of +0.9 in (2.3 cm) or a drop of 1.3 in (3.4 cm). That is the noise floor: a smaller move than that, in either direction, is within the error of the test rather than a real change.
Football. American football combine verticals come from a reach-and-jump test (jump up and touch the highest point you can), not a force plate, so they do not convert to these grids. Football also has one of the widest spreads between positions of any sport, with linemen and defensive backs far apart, which makes a position-by-position breakdown the right follow-up rather than a single football row.
Competition level moves the numbers in the same direction across every sourced comparison: higher level, higher jump. The step is gradual rather than dramatic, and it tends to run a bit wider for women than for men. That pattern holds whether or not a given study publishes its exact per-level figures.
Understanding Your Numbers
A reference band only means something if the athlete's number was measured the same way the band was. A force plate reads jump height from the actual force the athlete applies, along with how much power they produced and how fast they left the ground. Numbers from other setups do not drop into these grids cleanly: swinging the arms adds height a hands-on-hips test would not count, and a combine-style reach-and-jump vertical does not convert to a force-plate number at all. The device and measurement method decide whether two numbers can sit in the same grid.
Once the test setup is consistent, the next question is whether a change is real or just noise. A number from a different test, like a standing vertical jump benchmark, sits in its own range, so read it on its own terms rather than against the force-plate bands here. Even on the same plate, CMJ height drifts a little from jump to jump, so treat a small move as noise and trust the trend across several tests over any single session.
What to Do With a Benchmark
Jump height is only one slice of what a force-plate jump tells you. Two athletes can land in the same band for different reasons, one driving big peak power, another with a faster, more efficient mRSI, and the same CMJ that places them on these grids captures both. That is what separates knowing where an athlete sits from knowing why: height tells you the result, while power and mRSI off the same jump tell you how they produced it and what to train next. Read together with sprint and strength testing, that one jump is the front end of a full athletic profile.
The number from one test is only a starting point. Where an athlete lands on these grids tells the coach where they sit today; the trend on that same athlete over a training block or a season is what tells the coach whether the program is working. Read the first test against the right band, keep the test setup the same every time, and watch the line the athlete draws across the next ten tests.
References
Sources below are the original studies. Their published figures are ballistic jump height; the numbers in this post are those same figures expressed as true center-of-mass height (see the note above), so expect a raw study figure to read roughly two to four inches below the matching band here.
- Nikolaidis PT et al., 2014. Age-related Differences in Countermovement Jump in Soccer Players 8-31 Years Old. https://pubs.sciepub.com/ajssm/2/2/1/index.html
- A Comparison of Lower Body Power Characteristics Between Collegiate Athletes from Different Competition Levels (NCAA D-I vs NAIA). https://pmc.ncbi.nlm.nih.gov/articles/PMC7241620/
- Force Plate-Derived Countermovement Jump Normative Data and Benchmarks for Professional Rugby League Players. https://pmc.ncbi.nlm.nih.gov/articles/PMC9696698/
- Unlocking Basketball Athletic Performance: Force Plate-Derived CMJ Normative Reference Values From Seven NCAA D-I Power Five Men's College Basketball Teams. https://journal.iusca.org/index.php/Journal/article/view/354
- Badby AJ, Comfort P, et al., 2025. Normative data and objective benchmarks for selected force plate tests for professional and youth soccer players in the English Football League. Journal of Sports Sciences 43(20):2306-2323. https://www.tandfonline.com/doi/full/10.1080/02640414.2025.2523671
- Changes in Countermovement Vertical Jump Force-Time Metrics Across Different Competitive Levels in Women's Volleyball. International Journal of Strength and Conditioning. https://journal.iusca.org/index.php/Journal/article/view/294
- Philpott LK, Forrester SE, et al., 2021. Countermovement jump performance in elite male and female sprinters and high jumpers. Proc IMechE Part P. https://journals.sagepub.com/doi/10.1177/1754337120971436
- Haugen TA, Breitschadel F, Seiler S, 2021. Countermovement Jump Height in National-Team Athletes of Various Sports: A Framework for Practitioners and Scientists. International Journal of Sports Physiology and Performance 16(2):184-189. https://journals.humankinetics.com/view/journals/ijspp/16/2/article-p184.xml
- Suárez-Balsera et al. Profiling the Countermovement Jump Characteristics of Basketball Players across Competitive Levels and Playing Positions. https://pmc.ncbi.nlm.nih.gov/articles/PMC12121892/
- Position-specific countermovement jump characteristics of elite Women's Rugby World Cup 2017 athletes. Movement & Sport Sciences. https://www.mov-sport-sciences.org/articles/sm/full_html/2021/03/sm200080/sm200080.html
- Vertical Jump Performance in Hungarian Male Elite Junior Soccer Players. https://pubmed.ncbi.nlm.nih.gov/30901527/
- Xu et al. The Battle of the Equations: A Systematic Review of Jump Height Calculations Using Force Platforms. https://pmc.ncbi.nlm.nih.gov/articles/PMC11561012/
- Systematic overestimation of countermovement jump height by the flight-time method compared to impulse-momentum calculations. German Journal of Exercise and Sport Research. https://link.springer.com/article/10.1007/s12662-026-01096-7
- Assessing the Contribution of Arm Swing to Countermovement Jump Height Using Three Different Measurement Methods in Physically Active Men. Biomechanics 2025, 5(3):45. https://www.mdpi.com/2673-7078/5/3/45
- Reliability of Vertical Jump Force-Time Metrics in Collegiate Athletes Compared to Recreationally Active Individuals. https://pmc.ncbi.nlm.nih.gov/articles/PMC12733763/
- Between-Session Reliability of Strength- and Power-Related Variables during Isometric Leg Press and CMJ in Elite Female Ice Hockey Players. MDPI Sports 11(5):96. https://www.mdpi.com/2075-4663/11/5/96
- Dobbin et al. Identifying and reporting position-specific countermovement jump outcome and phase characteristics within rugby league. PLOS One. https://pmc.ncbi.nlm.nih.gov/articles/PMC8956158/
- Cormack et al. Reliability of Measures Obtained During Single and Repeated Countermovement Jumps. IJSPP 2008. https://www.innervations.com/resources/Reliability%20of%20measures%20obtained%20during%20single%20and%20repeated%20countermovement%20jumps%20-%20Cormack%20et%20al%20IJSPP%202008.pdf
- Pueo et al. Reliability and validity of the Chronojump open-source jump mat system. https://pmc.ncbi.nlm.nih.gov/articles/PMC7433325/
- Markovic & Nedeljkovic. Body size and countermovement depth confound the relationship between muscle power output and jumping performance. https://pmc.ncbi.nlm.nih.gov/articles/PMC3943730/
- Crewther et al. Scaling of speed, power, and strength in elite male rugby union players. https://pubmed.ncbi.nlm.nih.gov/21701284/
- SimpliFaster. Everything You Need to Know About the Countermovement Jump on Force Plates. https://simplifaster.com/articles/countermovement-jump-force-plates-guide/
- SimpliFaster. Developing an Athlete Monitoring Program with Jump Data. https://simplifaster.com/articles/athlete-monitoring-program-jump-data/


