
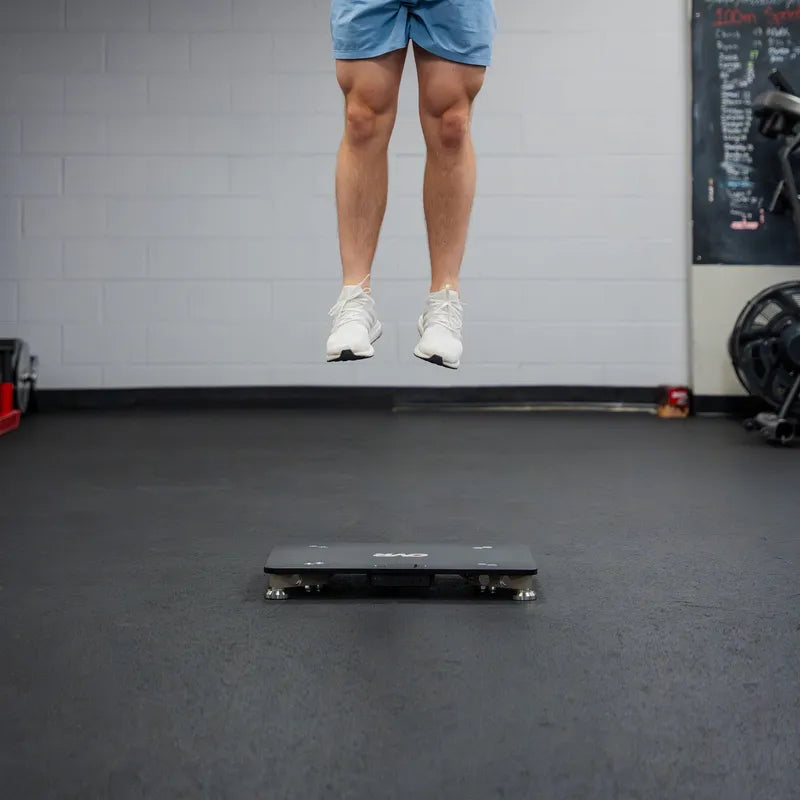


Two athletes hit the same 16-inch countermovement jump, hands on hips, and their force-time curves look nothing alike. A lean, springy guard drops shallow and snaps out of the bottom fast. A bigger, stronger forward sinks deep and takes longer to reverse. Jump height tells you what they did. The braking phase (the way down, when they drive force into the ground to stop falling) and the propulsive phase (the way up, when they push the ground to launch) tell you how they did it, and the how is what you train and monitor. Any force plate that reports phase data gives you both, but most coaches only read the number on top.
What the braking and propulsive phases actually are
Split a CMJ at the bottom of the dip, the moment the athlete stops moving down, and you have the two halves: braking before that point, propulsion after. Research papers call these the eccentric phase (muscles lengthening under load) and the concentric phase (muscles shortening to produce force). Most force-plate software, OVR included, labels them braking and propulsive.
One correction worth making early. Braking is not passive cushioning. It is active force production, the athlete driving force into the ground to slow and reverse a body that is still moving down.
The propulsive phase is the one that sets height. The best predictor of how high an athlete jumps is propulsive impulse: force into the ground multiplied by how long they apply it. It beats peak force (r is roughly 0.9 across studies, a very tight link). That is why two athletes can reach the same height through very different braking strategies. Height comes from propulsion. Braking is where the strategy shows up.
Two athletes, same jump height
Take the guard and the forward from the opening, both at 16 inches.
The guard uses a shallow dip and a short braking phase. Braking rate of force development (how fast they build force, often shortened to RFD) is high, the curve rises in one continuous push, and the athlete reverses almost as soon as they load. They reach the bottom and they are already coming up.
The forward drops deep and stays there longer. The braking phase is long, braking RFD is lower, and the force curve often shows two humps instead of one. Force sags in the changeover from stopping the drop to driving up, then has to rebuild, instead of staying high in one push. They take a longer, deeper path to the same takeoff, and lose more energy along the way. Same height, produced less efficiently.
Same number on the board, two different athletes. The height column does not tell them apart, but the braking phase does. This is not an edge case. Cluster a single group, even elite players, and the jump strategies spread out. A study of 178 NBA players found total movement times from around 0.72 seconds for the stiffest jumpers to nearly a second for the slowest, in distinct strategy clusters. There is no single normal jump shape. There is the shape your athlete uses, and whether it is changing.
What each phase tells you to train
A weak phase points to a specific fix, and the two phases point opposite directions.
Weak braking, low braking RFD, a long sloppy slowdown, means the athlete cannot control and reverse load fast. The fix is eccentric and reactive work, but match the method to the problem. Slow tempo eccentrics (lowering a load slowly under control) build strength and muscle. They do not improve fast braking. For that you want fast, reflexive eccentrics, plyometric and landing-absorption drills, and heavier-than-normal loading on the way down. A coach who prescribes 4-second negatives for an athlete who needs to reverse faster is training the wrong quality.
Weak propulsion is a different problem. If the athlete cannot produce enough force at all, the answer is heavier max strength work. If they produce strong force but take too long to apply it, the answer is ballistic and contrast work (fast, explosive lifts and jumps).
With a strength test alongside the jump, the dynamic strength index is the shortcut. DSI compares jump force to the force in a hard, near-maximal push against an immovable bar. Under about 0.6 and the athlete is strong but cannot express it fast, so bias toward ballistic, plyometric, and contrast work. Over about 0.8 and they are already using most of what they have, so bias toward heavy strength to raise the ceiling.
Braking as an early warning
Strategy and phase metrics tend to move before jump height does when an athlete gets tired. That is the practical reason to read them. A tired athlete can still hit their usual height by changing how they get there, dropping deeper or slowing the reversal, so the number on top holds while the shape underneath shifts.
One honest caveat, because the field tends to skip it. Which phase moves first depends on what tired them out. After team-sport running, the braking and strategy metrics often shift first. After a max sprint, the propulsive metrics tend to take the biggest hit and recover slowest. So do not assume braking always changes first. Watch the athlete's own trend on the same test. A braking phase drifting longer while height holds steady is an early signal you miss if height is the only thing you log. It is also one of the cleaner reads for managing in-season load.
What to watch, what to ignore
You do not need a hundred metrics. Pick the reliable reads and let the rest go.
Watch two things: the trend in how long the braking phase lasts, and the overall braking-to-propulsion shape. Both hold steady from session to session and both show strategy you cannot get from height. Impulse is reliable too, and so is rate of force when you read it over a window of time rather than at a single instant.
Ignore the noise. Peak RFD read at a single instant bounces around so much between reps that one value is close to meaningless. Landing-phase asymmetry (left-vs-right difference on the way down) is even noisier. Chasing either one rep to rep is chasing static.
One more point. Do not turn braking RFD into a target you grind on. Raising it does not reliably raise jump height. Treat any rate-of-force number the same way, as a read. It tells you what to train and how ready the athlete is. Train the quality the athlete is missing, then watch whether strategy and height respond.
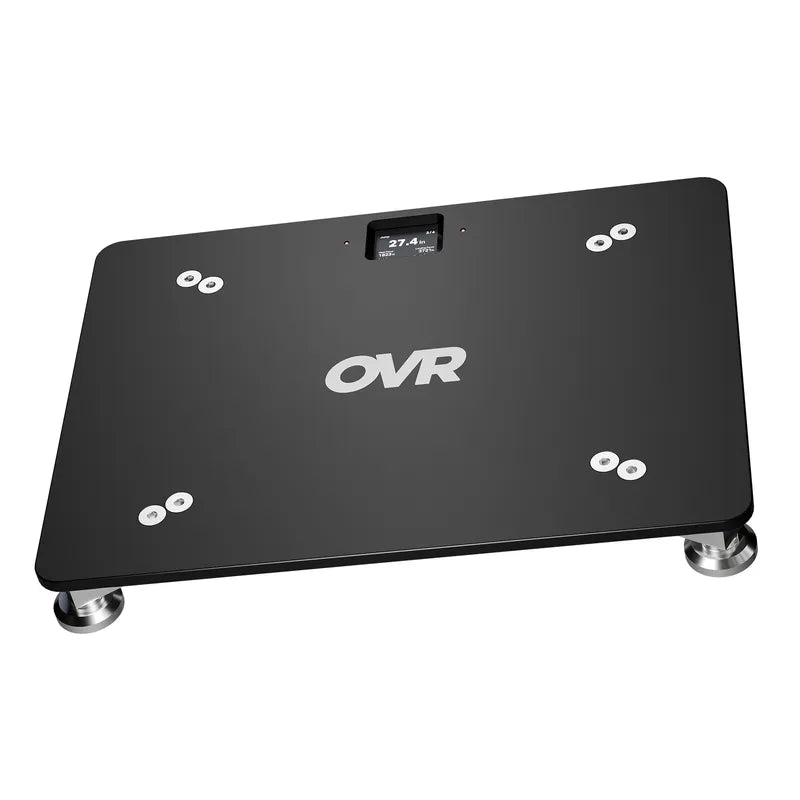
Keep the conditions constant or none of this compares. Same dip depth, same protocol (hands on hips or arm swing, pick one and hold it), same device. Systems time the braking phase differently, so a braking duration from one plate does not match another's number. None of this needs a ten-thousand-dollar subscription plate. A portable force plate that reports the phase metrics gives you the same braking and propulsion data, recorded the same way every session.
Reading the how, not just the how high
Jump height answers one question: how high did they go. The braking and propulsive phases answer the question that changes what you do on Monday: how did they get there, and what is missing. A coach who reads the phases knows whether a flat vertical is a strength problem or a speed-of-force problem, whether an athlete is tired before the height drops, and which of two athletes at the same height needs eccentric work versus heavy maximal strength.
Start with one thing. Next time you test, log braking phase duration alongside jump height for every athlete, and watch the two trend over a block. The athletes whose strategy drifts while their height holds are the ones telling you something first.
Sources
- McMahon, Suchomel, Lake, Comfort (2018). Understanding the Key Phases of the Countermovement Jump Force-Time Curve. Strength & Conditioning Journal, 40(4):96-106: https://journals.lww.com/nsca-scj/fulltext/2018/08000/understanding_the_key_phases_of_the.10.aspx
- Kirby, McBride, Haines, Dayne (2011). Relative Net Vertical Impulse Determines Jumping Performance. Journal of Applied Biomechanics, 27(3):207-214: https://pubmed.ncbi.nlm.nih.gov/21844609/
- Guess, Gray, Willis, Guess, Sherman, Chapman, Mann (2020). Force-Time Waveform Shape Reveals Countermovement Jump Strategies of Collegiate Athletes. Sports (Basel), 8(12):159: https://pmc.ncbi.nlm.nih.gov/articles/PMC7761544/
- Is a Bimodal Force-Time Curve Related to Countermovement Jump Performance? Sports (MDPI), 2018, 6(2):36: https://www.mdpi.com/2075-4663/6/2/36
- Rauch, Leidersdorf, Reeves, et al. (2020). Different Movement Strategies in the Countermovement Jump Amongst a Large Cohort of NBA Players. IJERPH, 17(17):6394: https://pmc.ncbi.nlm.nih.gov/articles/PMC7504515/
- McMahon, Lake, Comfort (2022). Identifying and Reporting Position-Specific Countermovement Jump Outcome and Phase Characteristics Within Rugby League. PLoS ONE, 17(3):e0265999: https://pmc.ncbi.nlm.nih.gov/articles/PMC8956158/
- Gathercole, Sporer, Stellingwerff, Sleivert (2015). Alternative Countermovement-Jump Analysis to Quantify Acute Neuromuscular Fatigue. IJSPP, 10(1):84-92: https://journals.humankinetics.com/view/journals/ijspp/10/1/article-p84.xml
- Watkins et al. (2024). Effects of high-intensity sprint exercise on neuromuscular function. PeerJ, 12:e17443: https://pmc.ncbi.nlm.nih.gov/articles/PMC11143976/
- Reliability of Vertical Jump Force-Time Metrics in Collegiate Athletes vs Recreationally Active Individuals (2025). Life, 15(12):1830: https://pmc.ncbi.nlm.nih.gov/articles/PMC12733763/
- Suchomel, Wagle, Douglas, et al. (2019). Implementing Eccentric Resistance Training, Part 2: Practical Recommendations. Journal of Functional Morphology and Kinesiology, 4(3):55: https://www.mdpi.com/2411-5142/4/3/55


